Shows tabular data. This is integrated with other charts so clicking on a row highlights the corresponding record in a chart.
{{display_table height="400"}}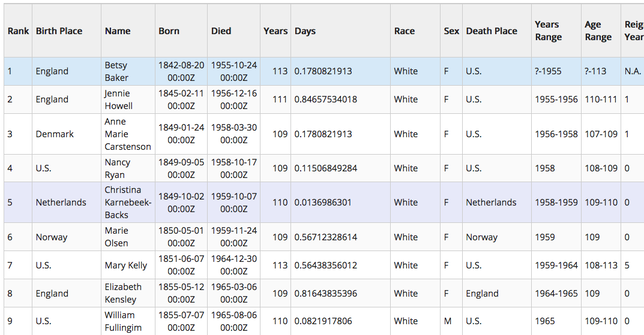 Image 1: Table
Displays the records, one row per record, with each cell color coded based on the field value and the specified color table.
{{display_heatmap type="heatmap" height="400" fields=""
colorTables="temperature,blues"
colorByMins="-90,0" colorByMaxes="45,100"
showIndex="false" showValue="true"
showBorder="true"
cellHeight="30"
textColor="white"}}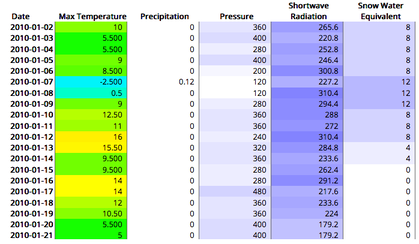 Image 2: Heatmap
Displays a statistical correlation of a set of fields.
{{display_correlation fields=""}}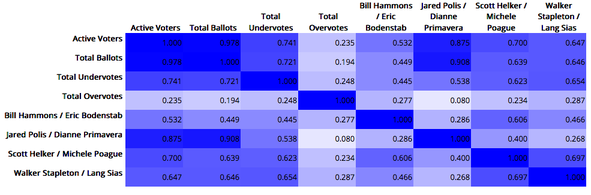 Image 3: Correlation
Displays the record selected in other charts.
{{display_text}}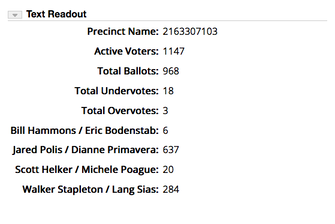 Image 4: Text Readout
The canvas display takes a specification of one or more glyphs which is used to
create a customized display for each record.
{{display_canvas canvasHeight="100" canvasWidth="100"}} Image 5: Canvas
The glyphs are specified by a set of attributes:
glyph1="<glyph type>,..."
glyph2="<glyph type>,..."
...
glyphN="<glyph type>,..."
See
canvasglyphs.html for more information.
Displays a summary statistics including average, min, max, number of missing, etc. There are a number of values that are shown. To turn all of them off and only set a few set the
showDefault to false.
{{display_stats loadData="false"
showDefault="true"
#showMin="true"
#showMax="true"
#showAverage="true"
#showStd="true"
#showPercentile="true"
#showCount="true"
#showTotal="true"
#showMissing="true"
#showUnique="true"
#showText="true"}}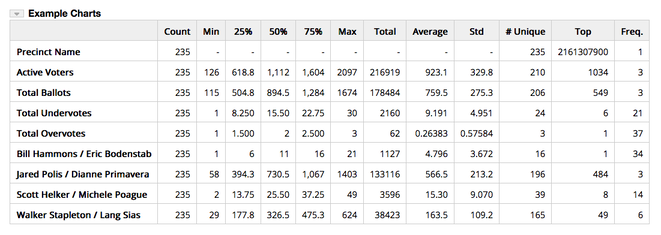 Image 6: Summary Stats
The template display displays text based on a template populated by data.
There can be a headerTemplate and footerTemplate specified that are used once.
The template= attribute is used to
show text for each record in the data. Not all template attributes need to be specified.
{{display_template template="..."   //Used for each record
headerTemplate="... ${totalCount} ... ${selectedCount}"  //used at the beginning
footerTemplate="... ${totalCount} ... ${selectedCount}"  //used at the end
selectField="field name to get the value to select on"  //specify a field to select on
select="max|min|<|>|=|>=|>=|contains"   //specify an operator
selectValue="some value"   //and a value
emptyMessage=""   //Message to show if nothing meets the selection criteria}}
The Dot plot requires a string value field and a numeric field.
It uses the string values as the Y-axis and shows the value
field along the X-axis.
{{display_dotplot fields="race,years_decimal"
xAxisTitle="Age"
marginLeft="200"
width="100%" height="300"}}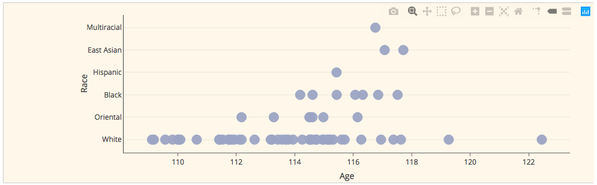 Image 7: Dot Plot
Displays flow data. The point data needs to have 2 string fields (the from and to) and a numeric value field.
If
doCategories is set to true then the display requires 2 string fields and a count of the
unique pair values of the strings are used for the values.
{{display_sankey doCategories="true|false"
height="400"
#fields=""}}
Example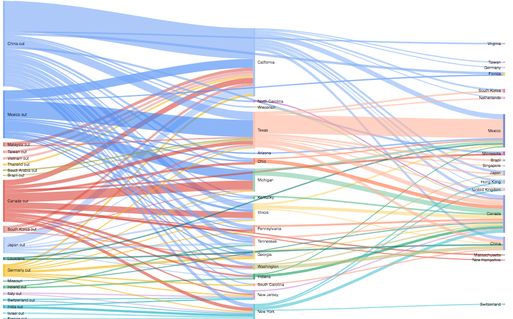 Image 8: Sankey
Shows a word or tag cloud of the text fields of point data. When the user clicks on a word
the data that matches the word value is shown in a table. The
tableFields attribute define what
fields to show in the table. If combined=true then all of the selected fields
are shown in one word cloud.
{{display_wordcloud fields="sex,race"
tableFields="rank,name,years,birth_place,sex,race"
combined="true|false"}}
Example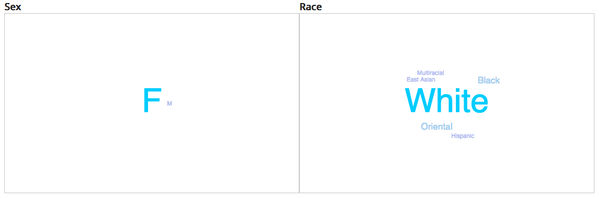 Image 9: Word Cloud
This creates a tree of the selected fields. Each row in the data is essentially converted to a "sentence", the
words of which are then displayed in tree form. If a field is numeric then the data is subvidided
by the numbero of buckets (the default is 10) and the "word" is the bucket range.
This can be overridden with the
numBuckets attribute. For a specific field append the
field ID to the attribute.
The bucket ranges can be specified with the
buckets attribute. The text label
to use can be specified with the
bucketLabels attribute.
The
treeRoot attribute is the text used to start the tree.
{{display_wordtree treeRoot="People"
fields="years,sex,race,name"

numBuckets="number of buckets to use for all numeric fields"
numBuckets.<field id>="number of buckets to use for a specific field"

buckets="100,110,115,120,130"
bucketLabels="Young,Middle,Old,Really old"
Or:
buckets.<field id>="100,110,115,120,130"
bucketLabels.<field id>="Young,Middle,Old,Really old"

height="800px"
chartWidth="900"}}
Example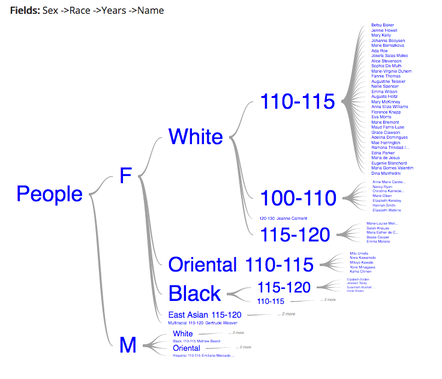 Image 10: Word Tree
Data that has 2 date fields can be shown in a timeline.
If
showLabel is true then text is shown inline in the timeline bars. The fields
that are shown are specified with the
labelFields attribute. The
labelFieldsTemplate
attribute defines how the label is shown.
{{display_timelinechart fields="rank,born,died"
width="100%"  height="800"
showLabel="true"
labelFieldsTemplate="{name}  Age: {years}  Birth Place: {birth_place}  Race: {race}"
labelFields="name,race,birth_place,years"}}
Example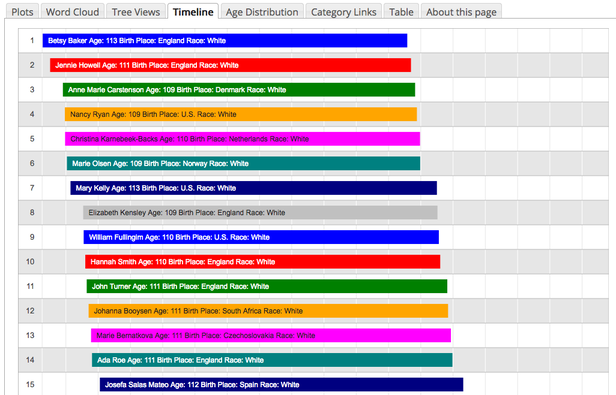 Image 11: Timeline