A templating mechanism is used in a
number of places within the displays to display the records. For example, as a
tooltip="..." or in the display_template. The template consists of
arbitrary text and any number of macros of the form:
${<field name> <modifiers> }
For example, if your record has a field "title" you can set a tooltip with:
tooltip="Title: ${title}"
There is also another property, selectPopup, that is a template like the
tooltip but pops up a dialog when a record is clicked.
Template Modifiers
There can be any number of modifier attributes specified within a macro.
For example, if one of the field values is a date (e.g. "date_field") then a format can be specified with:
${date_field format="yyyymmdd"}
Other modifiers include:
- ${field nonblank=true} - if the field value is a blank then don't show it
- ${field missing="MISSING"} - If the value is missing (e.g, NaN) then display the missing modifier
- ${field bar=true min=0 max=10 color=red width=100% height=12 border='1px solid #ccc' includeValue=true} -
Draw a bar within a box whose width is specified with the width modifier. The bar is ranged between min/max.
- ${field stars=true count=5 min=minvalue max=maxvalue color=red includeValue=true} - Draw stars
- ${field positiveTemplate='xxx ${value} ' negativeTemplate='yyyy ${value}' doAbsolute=false} -
If the value is positive then replace the '${value}' in the positiveTemplate with the value.
If negative then use the negativeTemplate. If doAbsolute=true and value is negative then show the absolute value
- ${field youtube=true autoplay=true width=400 height=400} - value is a Youtube url which is embedded
- ${field list=true} - Value is a newline separated list. Show it as a html list.
- ${field pre=true} - Wrap the value with a <pre> tag
- ${field urlField=some_other_field} - Get a url from the some_other_field and show an html href link.
- ${field offset1=10 scale=10.0 offset2=20} - Apply a scale/offset - result= (value+offset1)*scale + offset2
- ${field decimals=3} - Show the number of decimals
- ${field lowercase=true} - case change
- ${field uppercase=true} - case change
- ${field camelcase=true} - case change
- ${field prefix='Some prefix'} - add the prefix
- ${field suffix='Some suffix:'} - add the suffix
- ${field image=true title='Some title' width=width height=height} - Value is a URL to an image
- ${field images=true delimiter=";"} - Value is a list of images separated by the delimiter. If value starts with "[" then it is assumed to be a JSON list.
- ${field template=" xxx {value} yyy"} - Substitute {value} in the given template with the value
- ${field maxwidth=100px} - Wrap value in a div with the maxwidth
- ${field maxheight=100px} - Wrap value in a div with the maxheight
Special macros used in the template display
The display_template display also uses a number of special macros that allow for the
value of filter fields to be added in the template.
//In the header/footer:
${totalCount}  - total number of records
${selectedCount}  - number of filtered records

//In the pre record template -
${<field name>_min}
${<field name>_max}
${<field name>_total}
${<field name>_average}
These are the values specified by the user in the
filter widgets -
${filter_<field name>_min} //for numeric values
${filter_<field name>_max}
${filter_<field name>} //for enumerated and text values

//If the user does not specify a text filter value then just show blank
//If the user specifies some text filter value then wrap it with the prefix/suffix
${filter_<field name> prefix='some text prefix' suffix='some text suffix'}
Template Examples
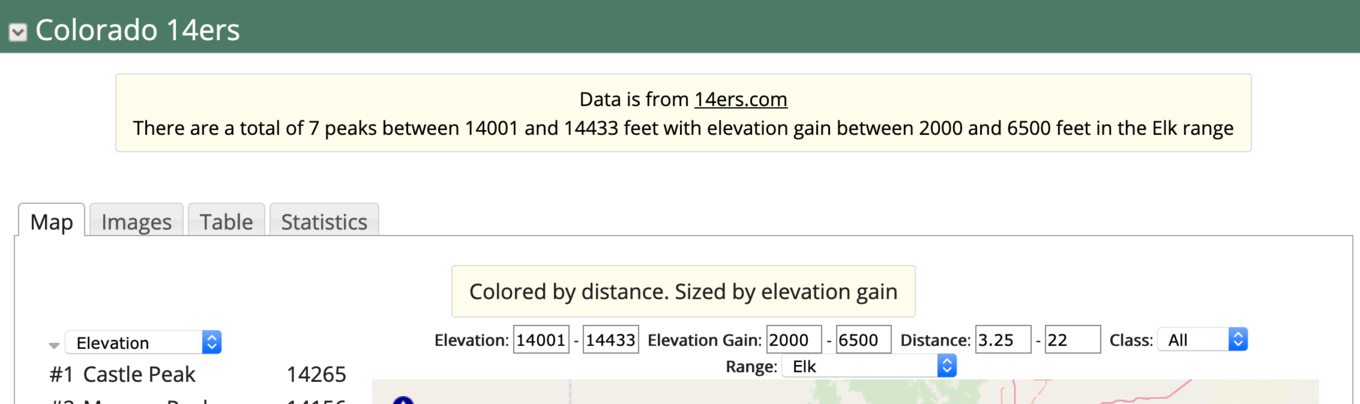
The below example (
see it here)
shows Colorado 14k foot peaks data. The display uses
filter fields
to allow the user to filter the data. The filter_... macros in the templates
display the values of those filter fields. The prefix/suffix attributes in the macros
allow one to show a phrase only if a text filter value is selected by the user.
The template display is specified as:
{{display_template  displayStyle="background:rgba(0,0,0,0);"
headerTemplate="There are a total of ${selectedCount} peaks
between ${filter_elev_min} and ${filter_elev_max} feet
with elevation gain between ${filter_elev_gain_min} and ${filter_elev_gain_max} feet
${filter_class prefix=' of class '}
${filter_range prefix=' in the ' suffix=' range'}"
filterFields="elev,elev_gain,distance,range,class" hideFilterWidget="true"
}}
The below display (from
here)
showing mass shooting data uses two different template displays as defined here.
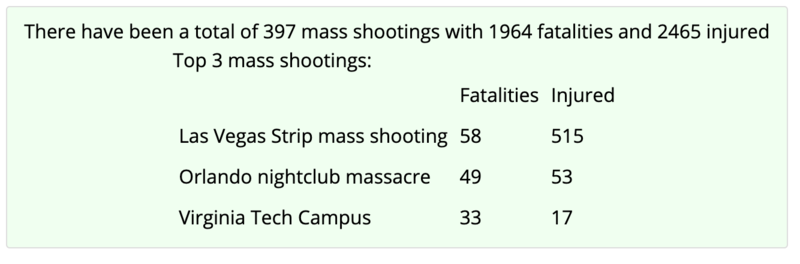 Image 2: Template Example
{{display_template
headerTemplate="There have been a total of ${totalCount} mass shootings with ${fatalities_total} fatalities and ${injured_total} injured"}}
{{display_template
headerTemplate="Top 3 mass shootings: <br><table cellpadding=5><tr><td></td><td>Fatalities</td><td>Injured</td></tr>"
template="<tr><td>${title}</td><td>${fatalities}</td><td>${injured}</td></tr>"
footerTemplate="</table>"
maxNumber="3"
sortFields=fatalities
sortAscending=false
}}
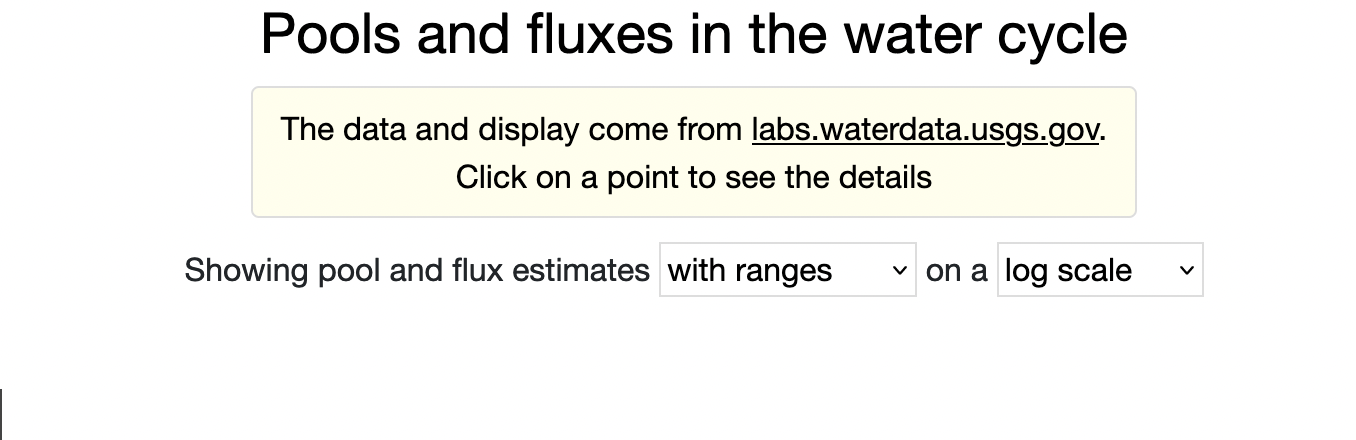
The headerText property specifies HTML and template macros for adding text and
interactive widgets that control a display.
For example the display at
ramadda.org uses the following headerText:
headerText="<center>Showing pool and flux estimates
  ${attribute labels=\"with ranges,without ranges\"
  fields=\"range_low_km_3_comma_value_km_3_comma_range_high_km_3,value_km_3\"}, on a
  ${attribute labels=\"log scale,linear scale\"
  xAxisType=log,linear}
</center>"
This results in:
Each macro is of the form:
{attribute labels="label1,label2,...,labelN"
somefield1="value1,value2,...,valueN"
somefield2="value1,value2,...,valueN"
A menu is created with the labels. On user interaction with the menu the properties, e.g., somefield1, somefield2, will be set based on the corresponding value.
In the above example this sets the "fields" property on the
display to the specified value in the fields comma separated list
(not some values contain commas which are escaped with _comma_).
It also sets the xAxisType property to one of "log" or "linear".
Derived data can be calculated by specifying a javascript function with the field ids. For example, in the
election data example
one of the displays shows the turnout percentage using the following attributes:
function="total_ballots/active_voters"
functionName="turnout"
The full wiki text is:
{{display_areachart  column="0"
layoutHere="true"  showTitle="true"  title="Line Chart with Function"
vAxisMinValue="0" vAxisMaxValue="1.0" padRight="true"
function="total_ballots/active_voters" functionName="turnout"}}
Percentage values can be calculated with the
showPercent attribute. This sums up the values of all of the specified fields and uses the
percent value.
Scaling and offset of data
The data values and or displayed unit of the point data that is displayed in chart can be modified
by specifying offset and scale units. For example, one can convert Kelvin to Celsius in a display
with the following attributes:
{{display_linechart offset1=-"273.15" unit="C" }}
There are also scale and offset2 values supported where the end value is calculated as:
value = (offset1+value)*scale + offset2
You can specify values specific for a particular field using:
{{display_linechart Temperature_surface.offset1=-"273.15" Temperature_surface.unit="C"
}}
Setting shared properties
Sometimes there are a number of displays on a single page that share the same set of properties.
For example, this
page
shows a number of charts of atmospheric time series data. The data itself has temperature in Kelvin and pressure in Pascals.
However, the displays show the data in Celsius and Hectopascals. As described aboce a scale, offset and new unit
for the displays showing temperature and pressure data can be specified. However, because there are a number of displays
that show this data one would have to specify these attributes for every display tag. However, using the
displayPropert
tag global properties can be specified that are applicable to all displays on the page:
{{displayProperty name="Temperature_surface.offset1" value="-273.15"}}
{{displayProperty name="Temperature_surface.unit" value="C"}}
{{displayProperty name="Pressure_surface.scale" value="0.01"}}
{{displayProperty name="Pressure_surface.unit" value="hPa"}}
You can specify certain macros in your wiki text the value of which can be specified by
either a special "wikiproperties" entry property or by a repository wide RAMADDA property.
In your wiki text a wiki property macro is defined by:
.... ${wikiproperty.<some property name> default="some default value"} ...
For example, the CR1000 data logger entry type has default wiki text with the following
wiki properties:
{{display_linechart
fieldsPatterns="${wikiproperty.cr1000.field1 default=".*temp.*|.*hmo.*|.*flow.*|rpsdata_1|.*cell_1"}"
lastRecords="${wikiproperty.cr1000.count default="5000"}"}}
{{display_linechart
fieldsPatterns="${wikiproperty.cr1000.field2 default=".*ph.*|.*rh.*|batt_volt_min|.*area.*|rpsdata_2"}"
lastRecords="${wikiproperty.cr1000.count default="5000"}"}}
{{display_linechart
fieldsPatterns="${wikiproperty.cr1000.field2 default=".*depth.*|.*pres.*|baro.*|.*dewpt.*|.*vol.*|rpsdata_3"}"
lastRecords="${wikiproperty.cr1000.count default="5000"}"}}
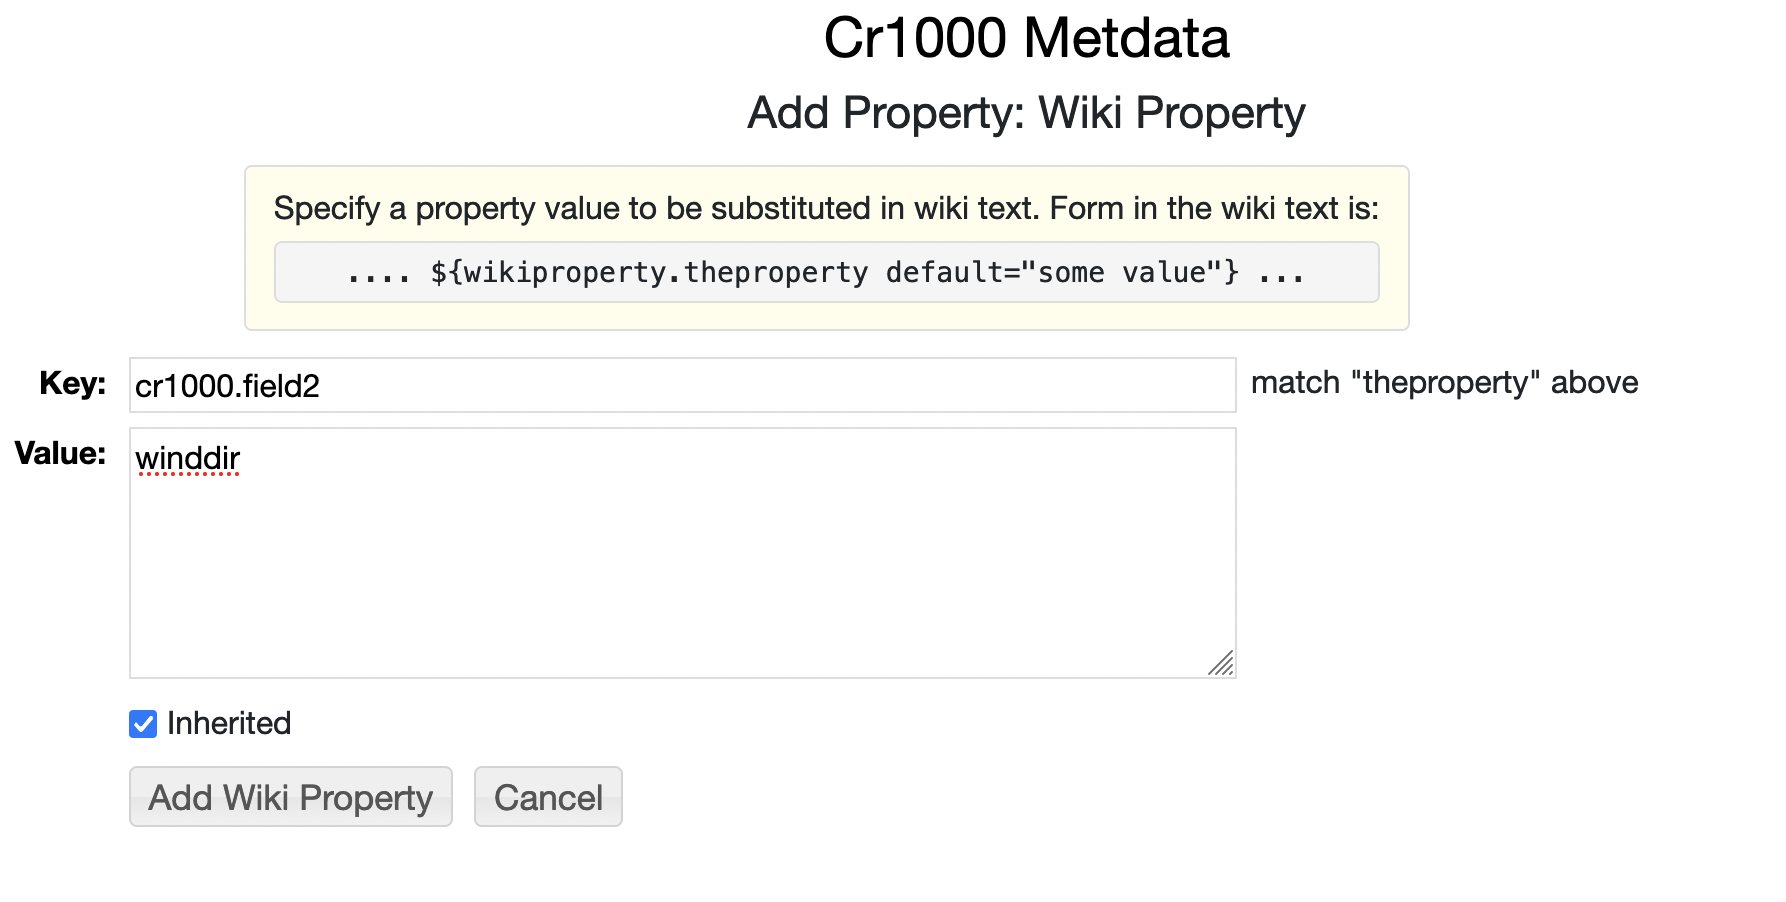
If you wanted to override what fields are used simply go to Add Properties and select "Add Wiki Property"
under the "Thumbnails, Page Style, Etc." section. The Key is the macro name without the "wikiproperty." prefix. The
value is the text that is substituted for the macro. In the below case we are overriding the field that is displayed
for the second line chart. If you wanted to have this property applied to a whole collection of CR1000 entries
then add the property to the container folder and check off "Inherited".
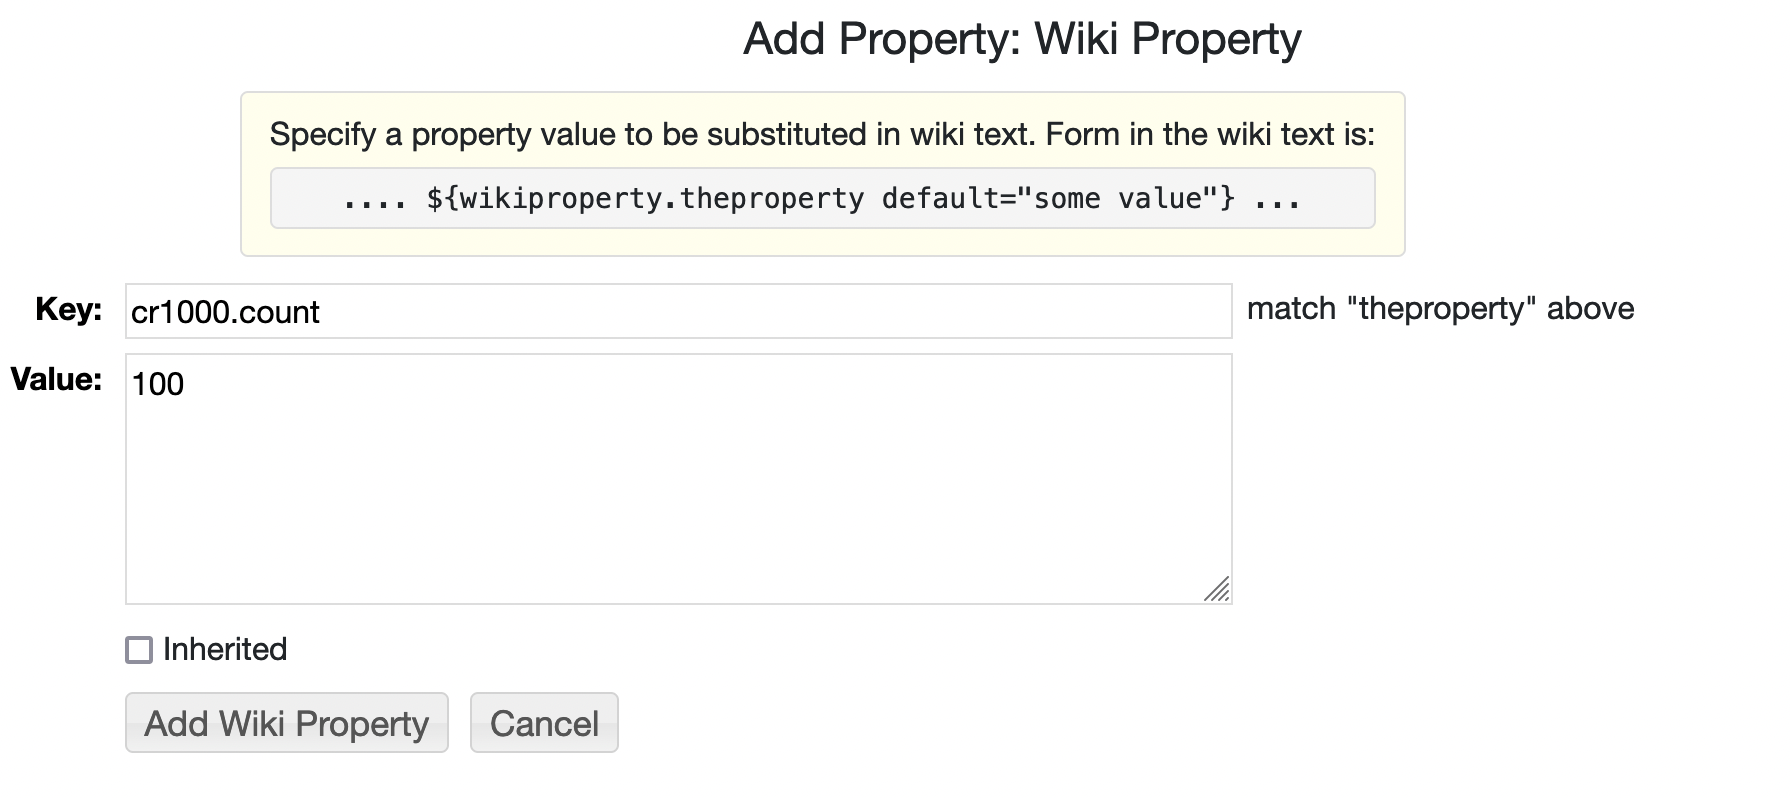
For the case of the CR1000 entries the number of records can also be specified with the "cr1000.count" property:
To specify a wiki property system wide add a property definition with the fill property name
to the repository.properties file in your RAMADDA home directory:
wikiproperty.cr1000.field1=some value
You can filter the data that is shown based on string pattern matching or numeric operators.
You do this with the attributes:
patternFilterField="field id"
filterPattern="some string"
numericFilterField="other field id"
numericFilterValue="number"
numericFilterOperator=">|>=|==|<|<="
e.g.: below would only show data where the 1st matches the string "Texas" and the 3rd needs to be less that 5000.
{{display_sankey height="800"
patternFilterField="#1" filterPattern="Texas"
numericFilterField="#3" numericFilterValue="5000" numericFilterOperator=">"
}}