
|
|
|
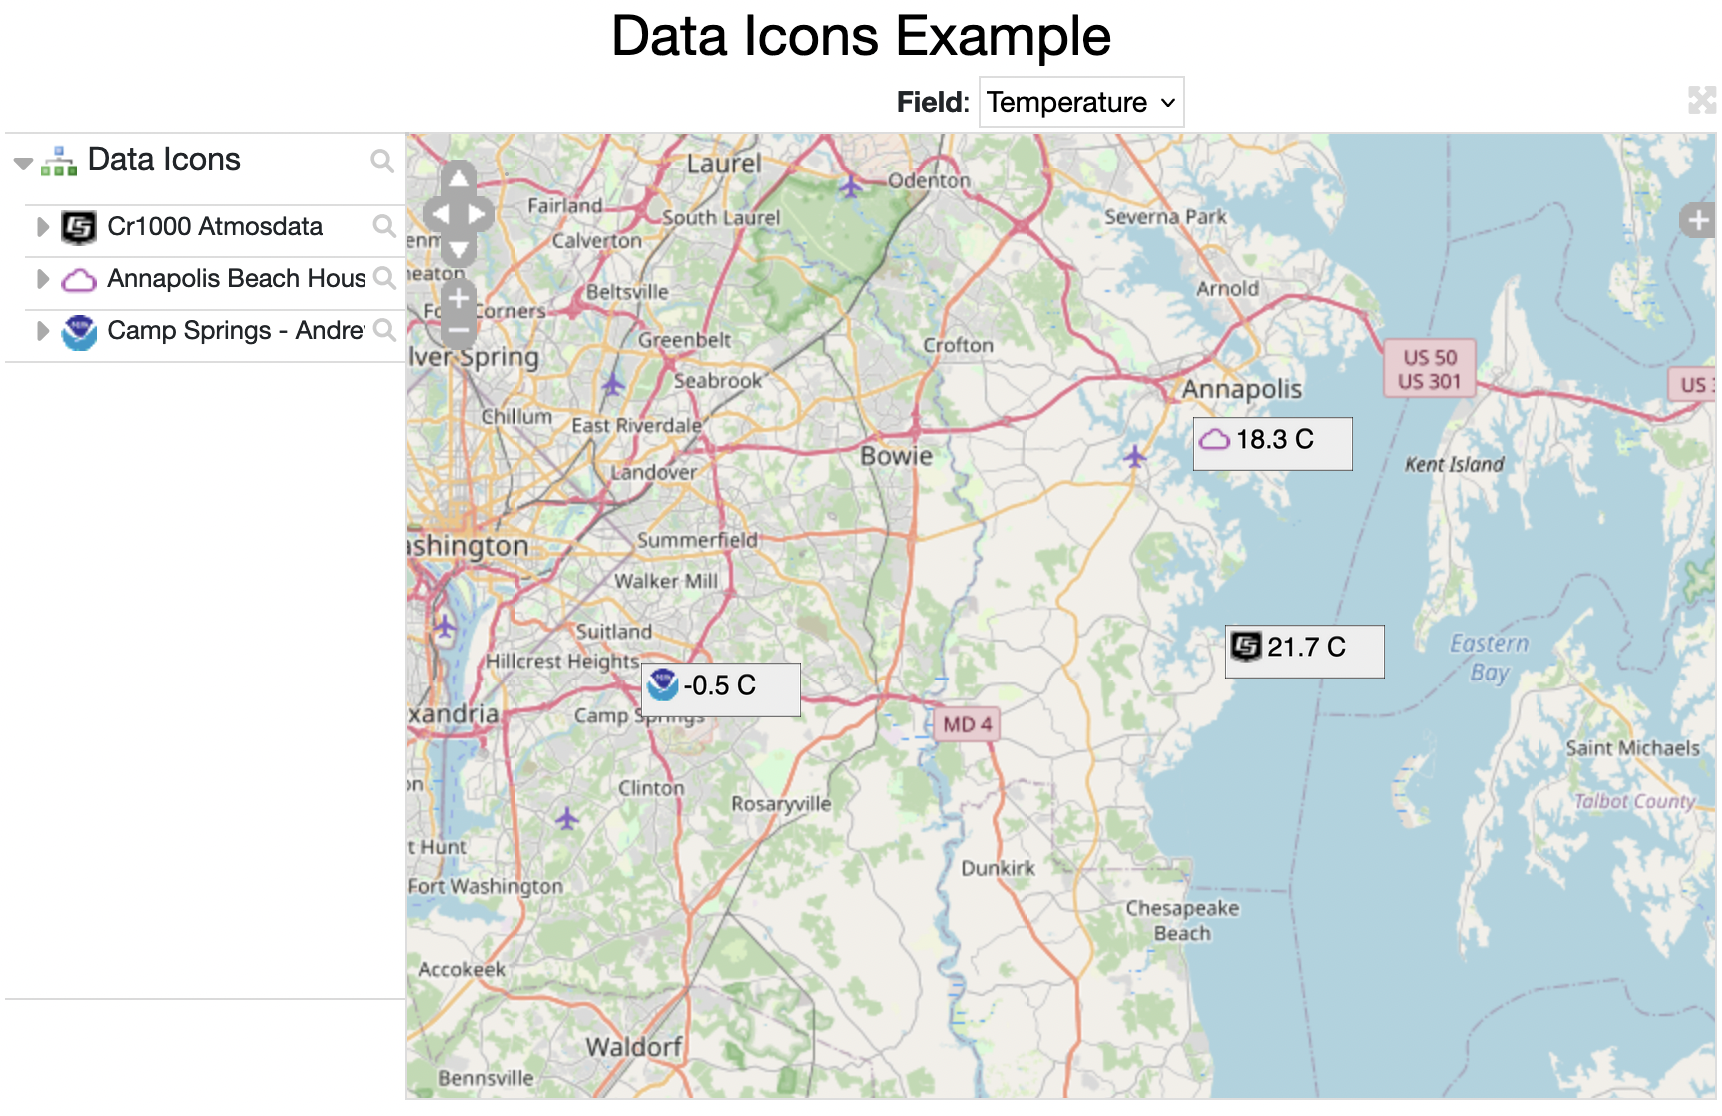
Both the Multi-Entry Glyph
and the Group Glyph can be configured so that all of their
children glyphs are displayed with the same data icon.
|
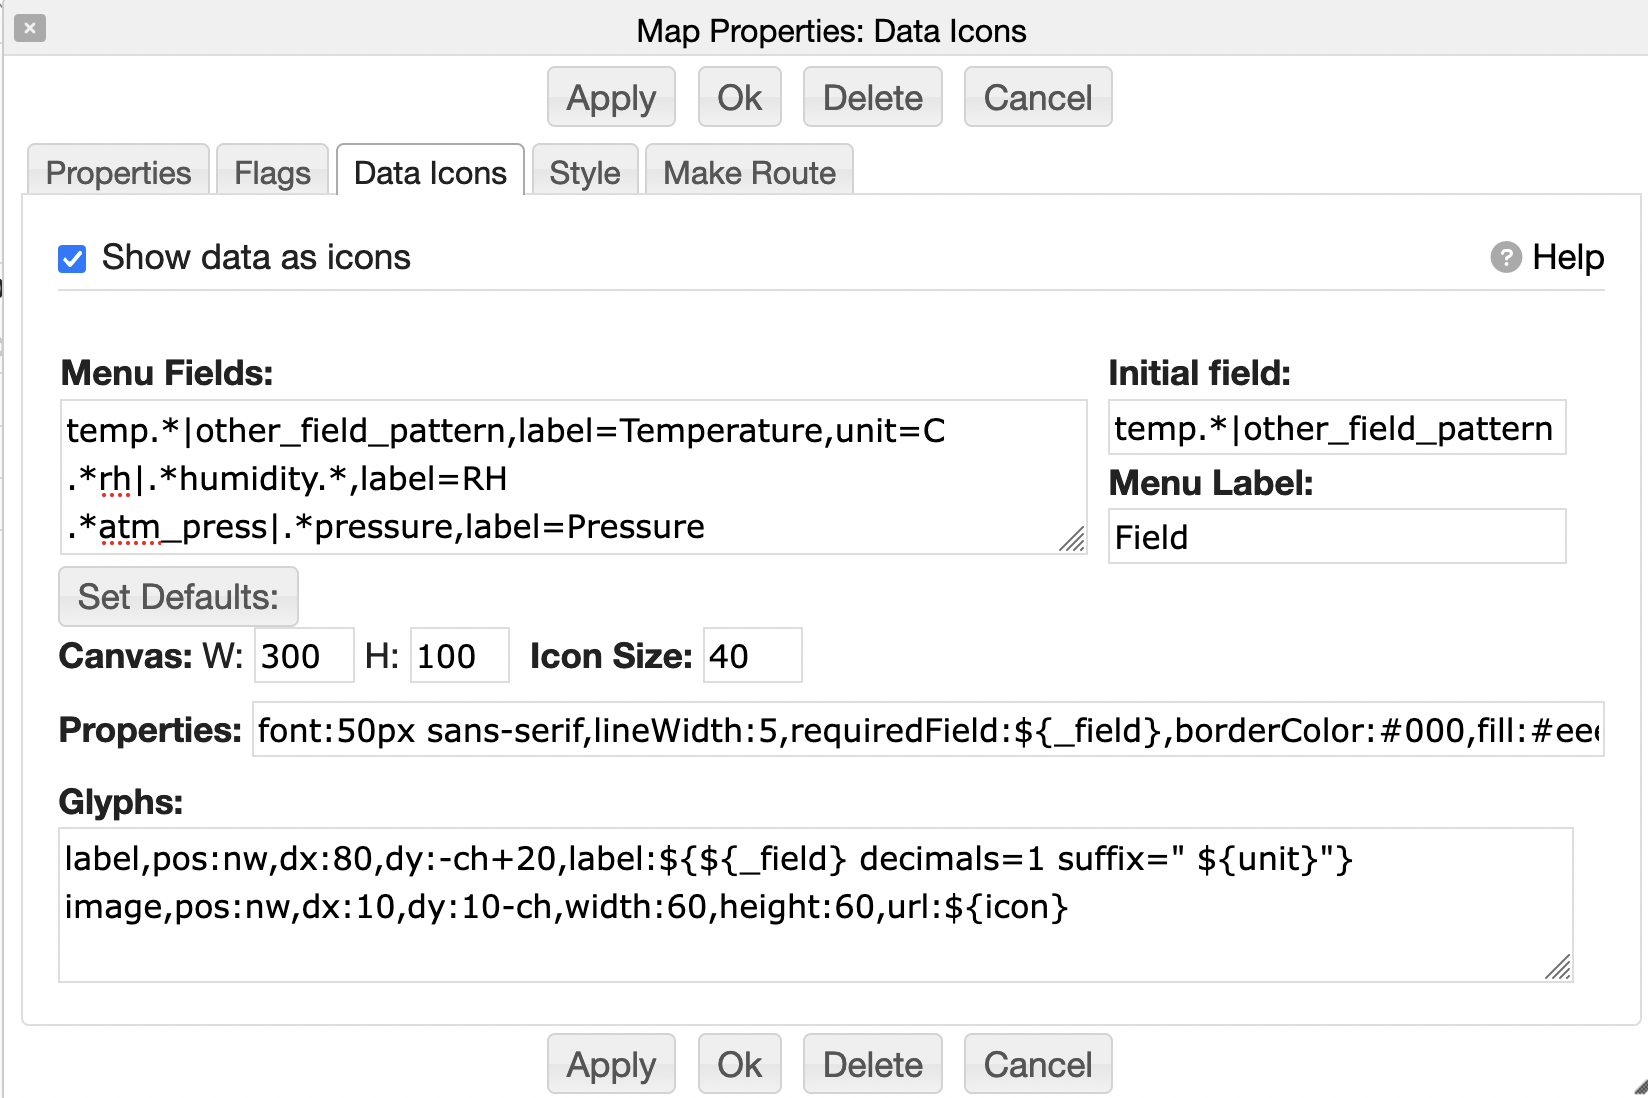
temp.*|other_field_pattern,label=Temperature,unit=C
.*rh|.*humidity.*,label=RH
.*atm_press|.*pressure,label=Pressure
windspeed,label=Wind Speed
pm1.0
pm2.5
pm10.0
#What font to use for the label Glyph
font:50px sans-serif

#If the data does not have the specified field then the icon is not shown
#the ${_field} is a macro that is replaced with the selected field
#from the Field Menu
requiredField:${_field}

#This specifies the background and line color for the rectangle
borderColor:#000
fill:#eee
lineWidth:5
The Glyphs are the drawing commands, one per line.
#Draw a label with the given template
#The ${_field} is a macro that is replaced with the selected field
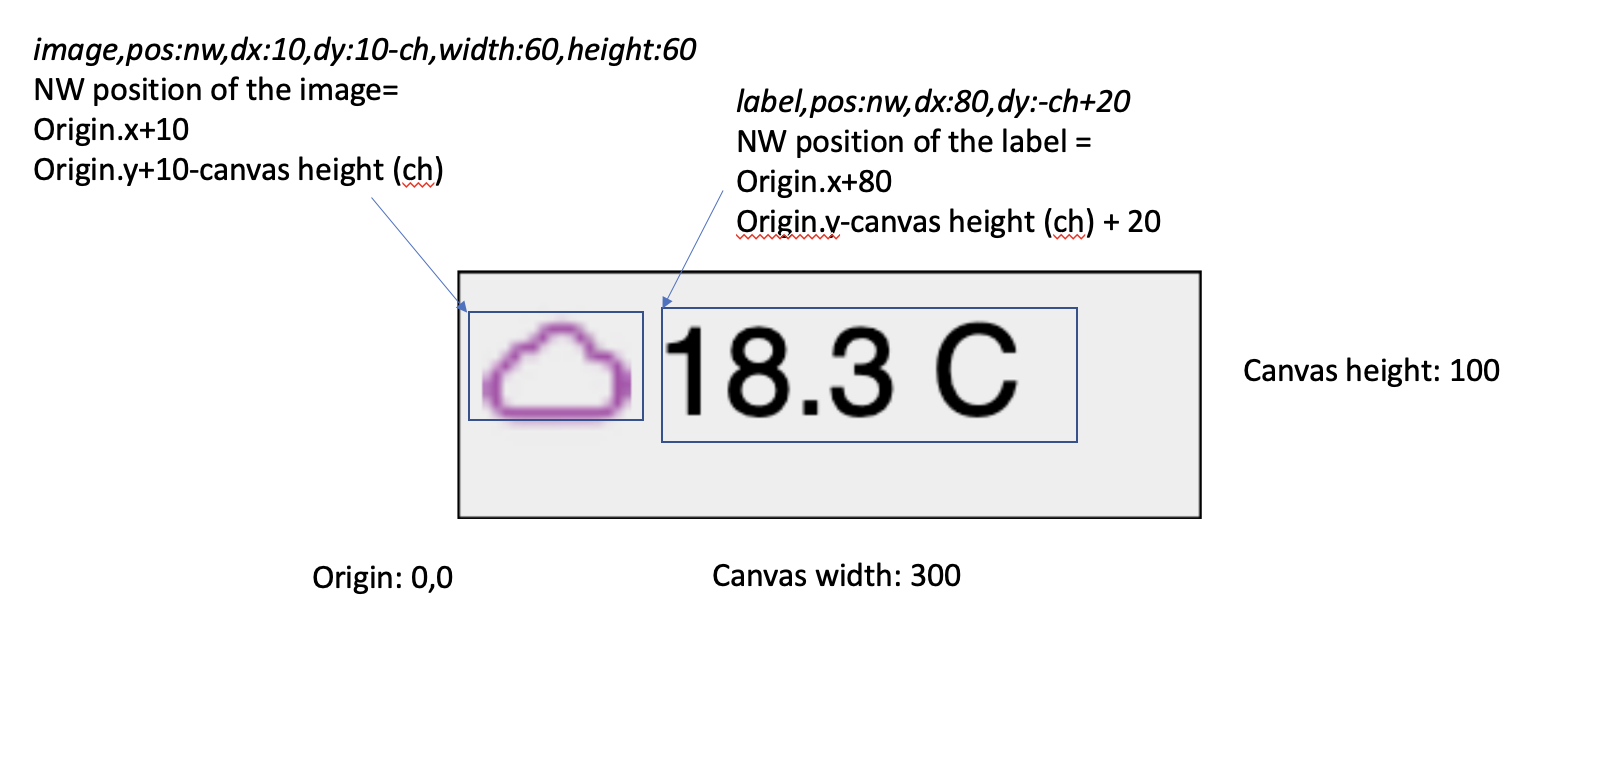
label,pos:nw,dx:80,dy:-ch+20,label:${${_field} decimals=1 suffix=" ${unit}"}
#Draw an image with the icon for the Map Glyph
image,pos:nw,dx:10,dy:10-ch,width:60,height:60,url:${icon}
The following diagram shows how the label and the image are layed out.
The canvas dimensions are 300x100. The origin of the canvas is the lower left with
positive X to the right and negative Y going up.
The "pos" is the position on the glyph which is positioned
relative to the origin and can take on the values: nw,w,sw,s,se,e,ne,n,c (center).
The dx and dy are the delta from the origin. These can be absolute values as well as
can be based on the canvas width and height -cw & ch
and the half the canvas width and height -cw2 & ch2.
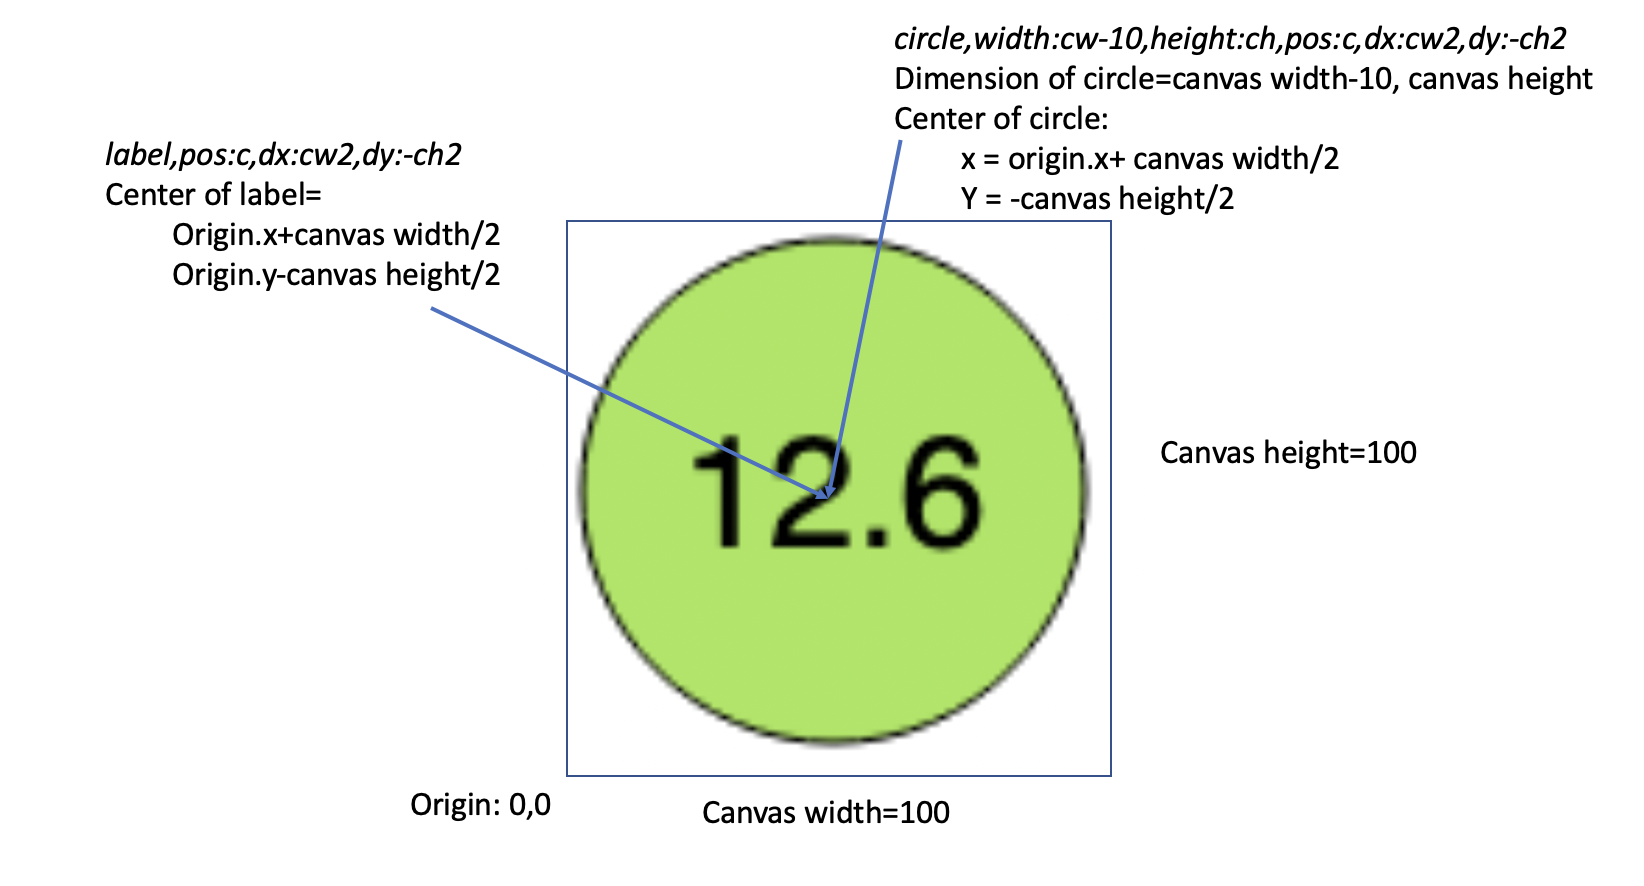
fontSize:0px,iconSize:20,canvasWidth:100,canvasHeight:100,font:28px sans-serif,defaultField:pm2.5And Glyphs:
circle,width:cw-10,height:ch,pos:c,dx:cw2,dy:-ch2,colorBy:${_field},colorTable:airquality,colorByMin:0,colorByMax:300
label,pos:c,dx:cw2,dy:-ch2,label:${${_field}}
The positioning is as follows:
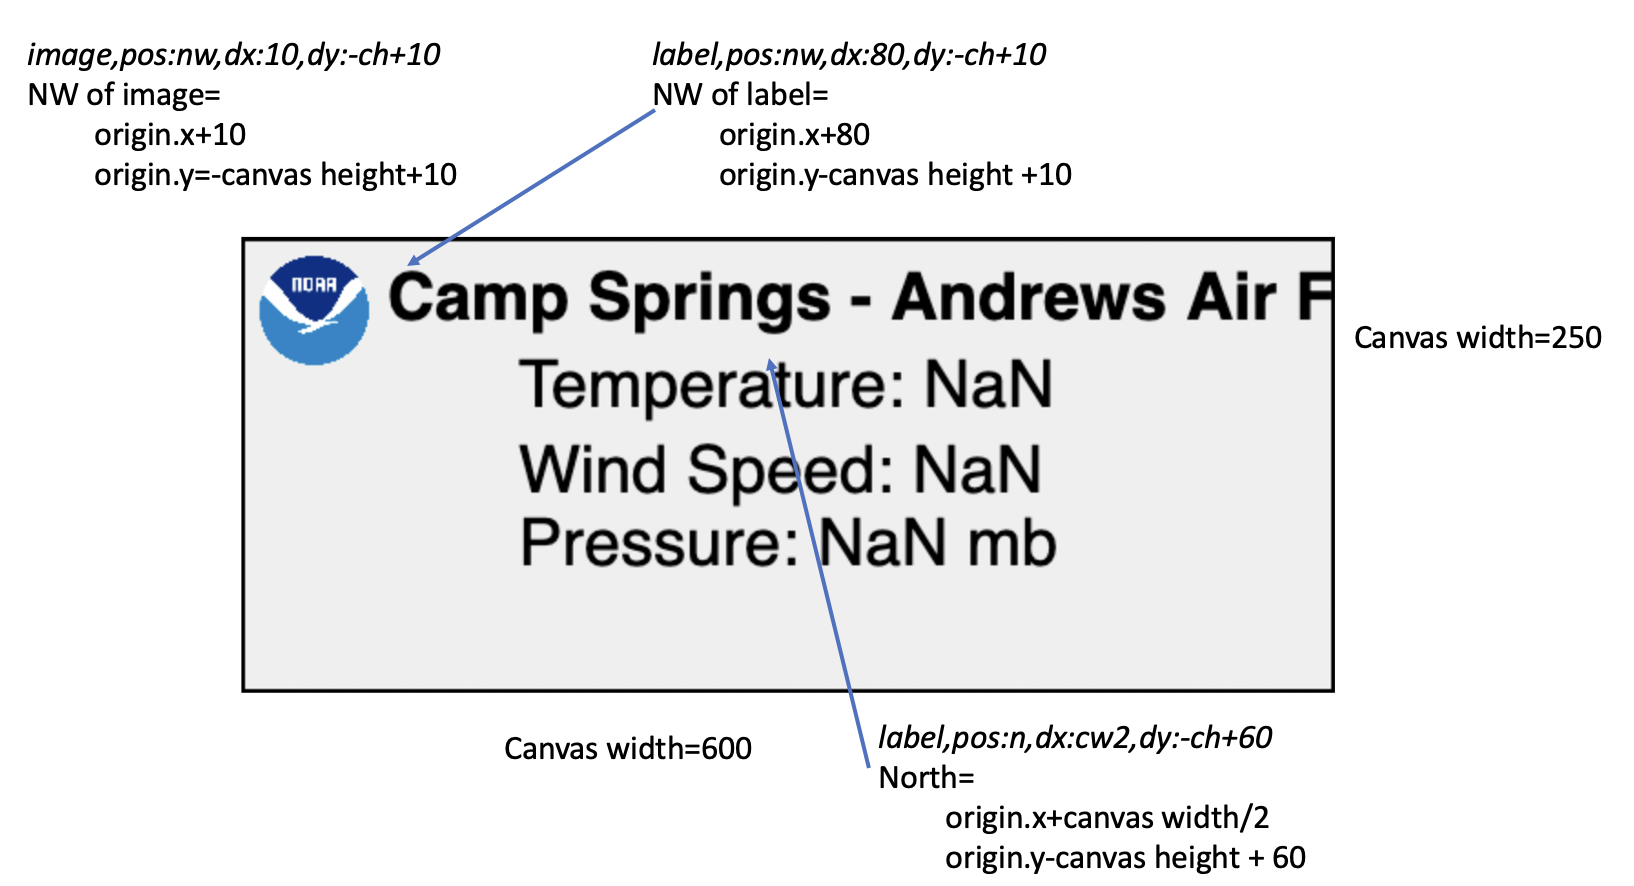
iconSize:75,canvasWidth:600,canvasHeight:250,fill:#efefef,borderWidth:2,borderColor:#000,font:bold 36px sans-serifWith Glyphs defined as:
image,pos:nw,dx:10,dy:-ch+10,width:60,height:60,url:/repository/point/noaalarge.png
label,pady:5,pos:nw,dx:80,dy:-ch+10,label:${entryname}
label,pady:10,pos:n,dx:cw2,dy:-ch+60,font:36px sans-serif,label:${temperature prefixLabel=true}
${windspeed prefixLabel=true}
Pressure: ${barometricpressure scale=0.01 decimals=1} mb
Here there are 2 labels - the name of the entry and a 3 new line separated field values.
This gives: