The Multi-Entry Glyph allows you to select a folder entry in RAMADDA and display all of the geo-referenced children entries.
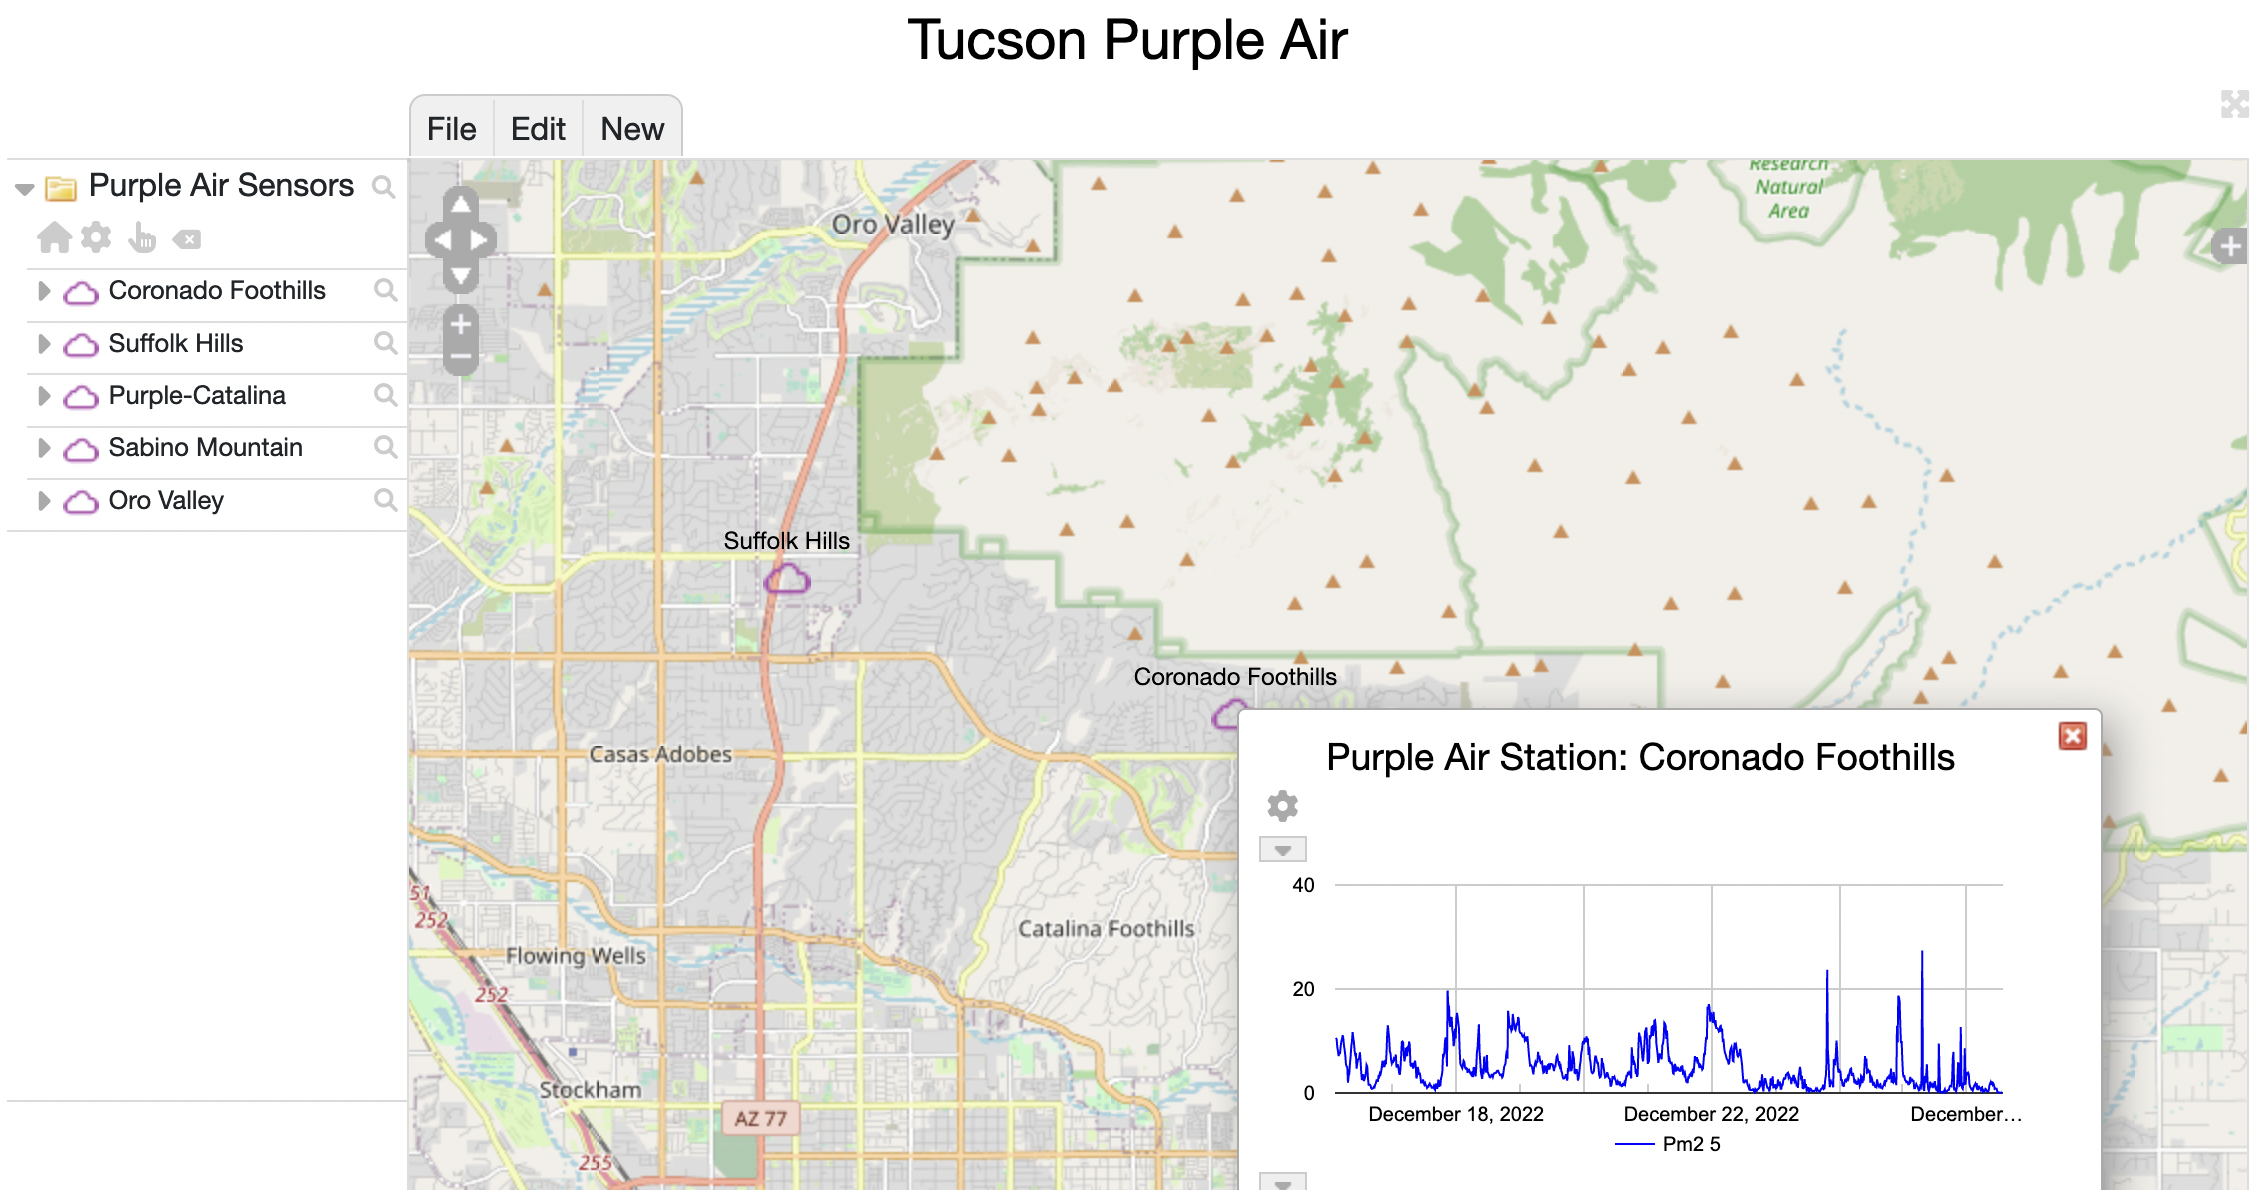
Showing Purple Air sensor data
Here we describe how to show a collection of Purple Air sensors in an IMDV map that is similar to this one. You can download and import this example into your RAMADDA with this .zip file- https://ramadda.org/repository/a/userguide_purpleair. This import contains the IMDV map shown here as well as a number of Purple Air sensor entries. Alternatively, you can use your own collection of Purple Air sensor entries and create an IMDV entry.

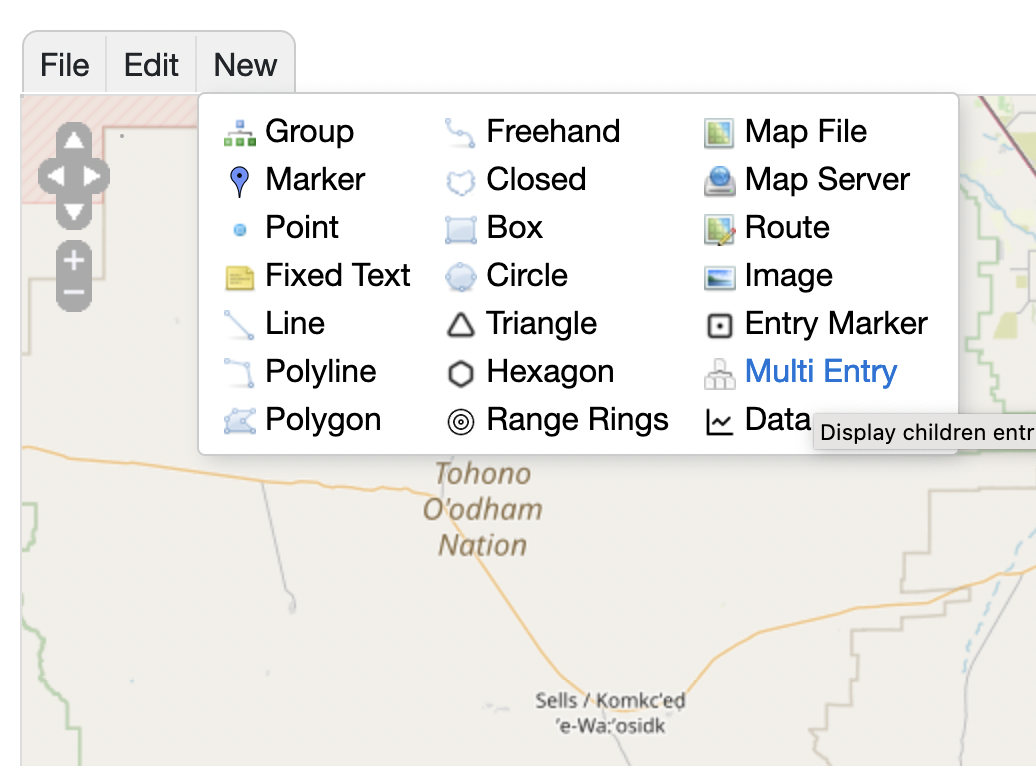
Creating a Multi-Entry glyph
First, create a new "Multi Entry" glyph under the New menu
images/newmultientry.png?version=74.0
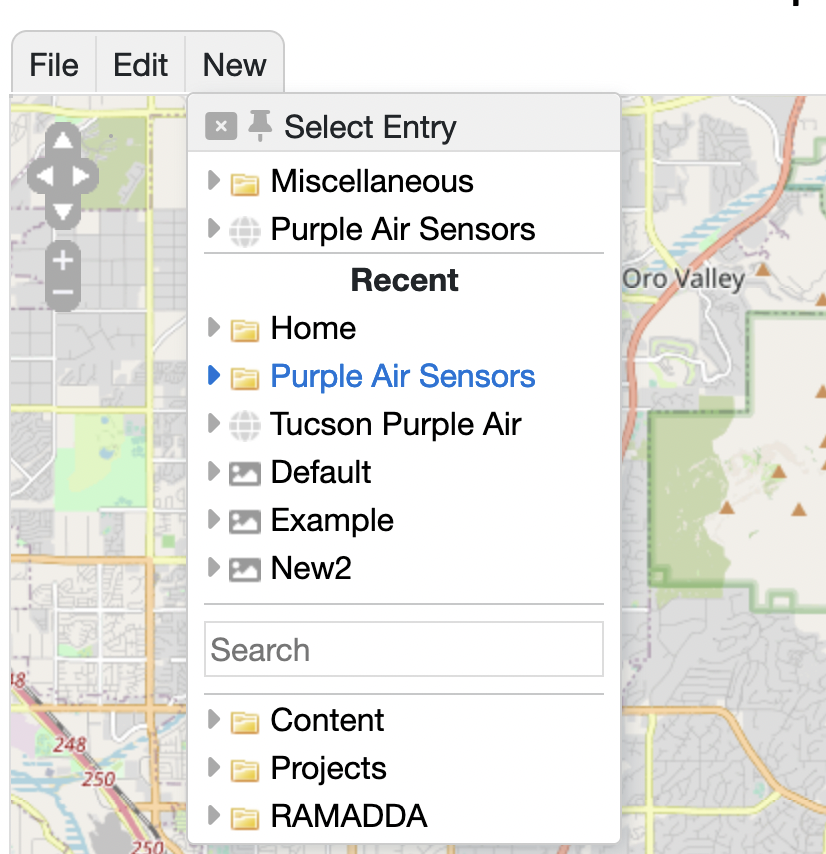
In the Select Entry form select the Purple Air Sensors folder that holds your sensor entries. Note: the Multi-entry glyph can show any collection of entries.
images/selectmultientry.png?version=74.0
You should have a default map that just shows the entry icons. Clicking on an icon will show the Purple Air time series.
images/defaultmultientry.png?version=74.0
Showing data icons
If the children entries of the Multi-Entry are data then you can show the most recent data instead of the default icons. For example, the Purple Air sensors can show the PM2.5 measurements and a color coded circle.
images/purpleair.png?version=74.0
NWS station data shows temperature, wind speed and pressure:
images/nws.png?version=74.0
CR1000 data logger entries show either temperature or relative humidity:
images/cr1000.png?version=74.0
To enable data icon displays bring up the Properties dialog for the Multi-Entry with the in the legend:
images/multientrylegend.png?version=74.0
Under the Data Icons tab select "Show data as icons" and press OK. Your map should now show the sensor data.
images/multientryprops.png?version=74.0
You should have a map that looks like below. From the top-level File menu select Save.
images/multientrymap1.png?version=74.0
Adding a field select menu
You can add a pull down menu at the top of the page that allows the user to select which field is displayed. To do this you will first need to know what are the field identifiers for the data entry. Navigate to one of the data entrys you will be displaying, e.g., the Purple Air sensor and view the Metadata page (from the entry's popup menu) to show the metadata. Note the fields you want to use. For Purple Air we are going to use pm1.0, pm2.5 and pm10.0.
images/metadata.png?version=74.0
Now, back to the IDMV map, bring up the properties dialog for the multi-entry. Under the Menu Fields add the fields you want to use. Optionally you can specify an initial field and a menu label.
images/multientryprops2.png?version=74.0
You should now have a menu shown that allows you to select the field to display:
images/multientrymap2.png?version=74.0
You can specify an alternative label to show in the menu as below by specifying a label=... property in the Menu Fields:
images/multientryprops3.png?version=74.0