| If any entry that is also a data entry is being displayed in the IMDV map
then the marker shown in the map
can display the most recent data for the entry. This includes individual
Entry glyphs, entries added under a Multi-Entry and any entryies under a Group glyph.
|
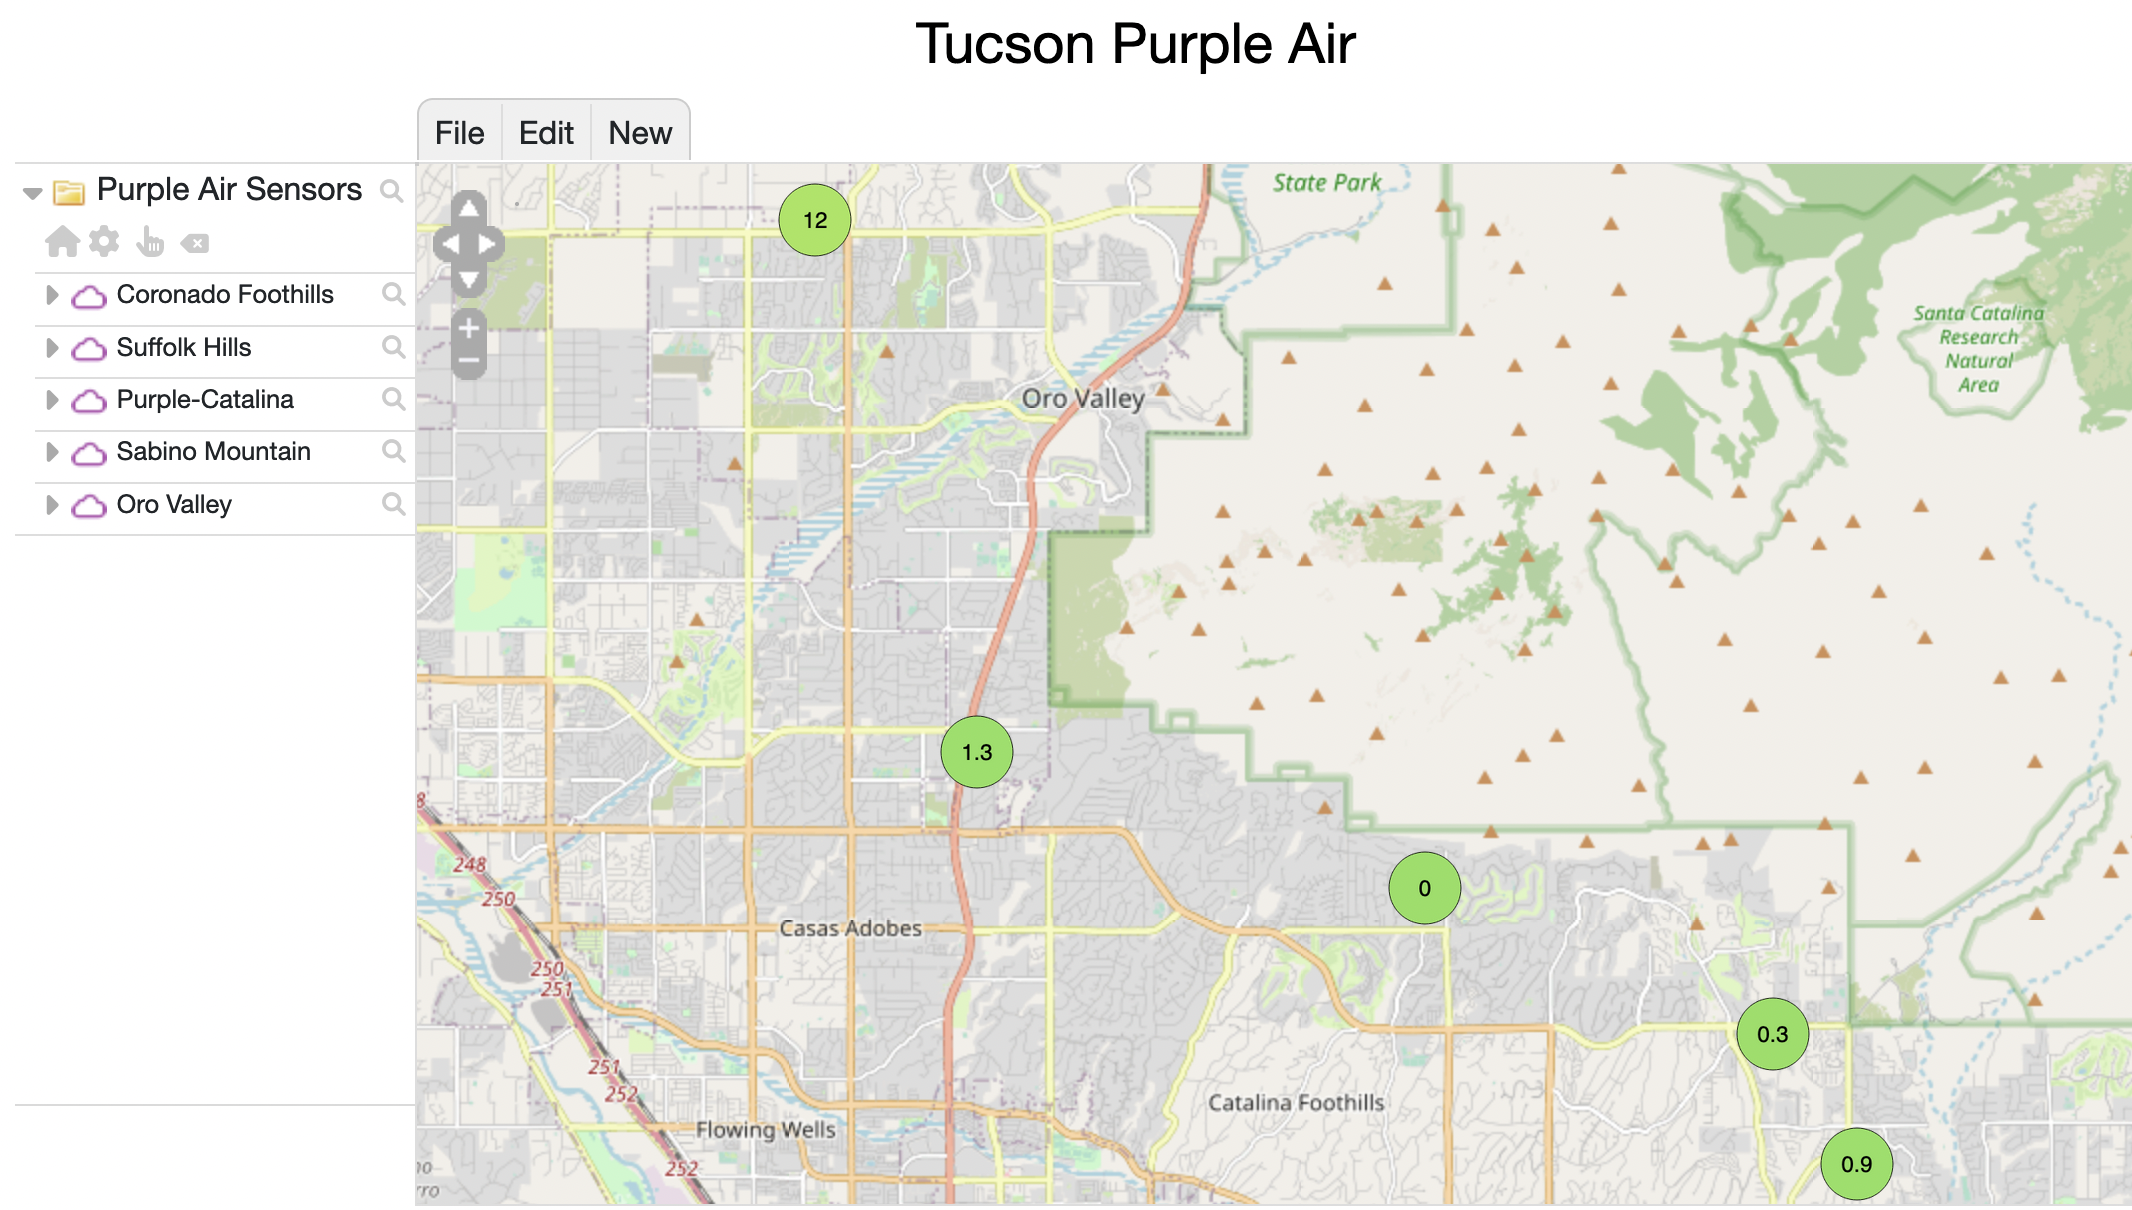
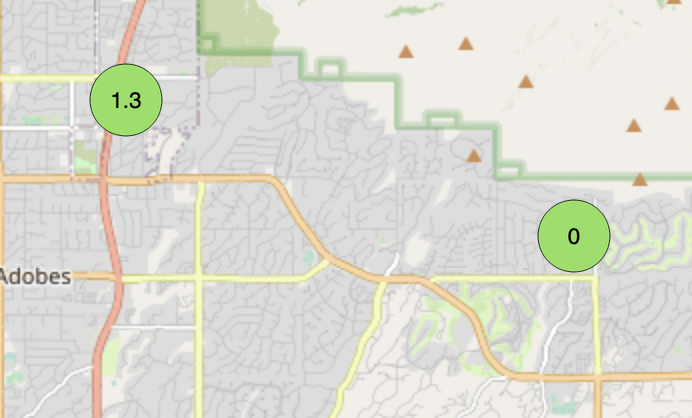
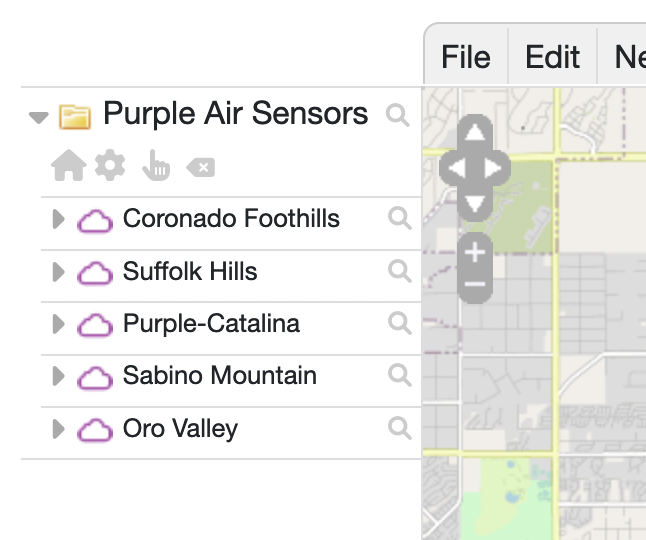
For example, the Purple Air sensors can show the PM2.5 measurements and a color coded circle.
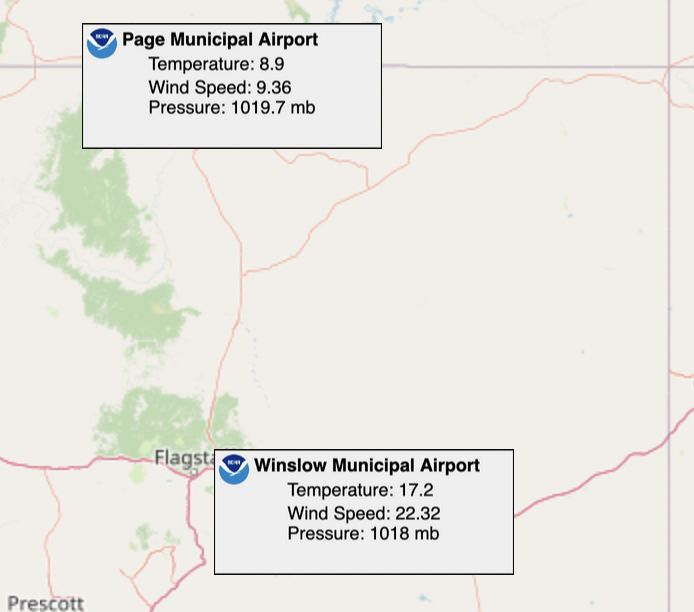
NWS station data shows temperature, wind speed and pressure:
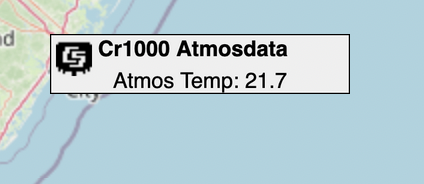
CR1000 data logger entries show either temperature or relative humidity:
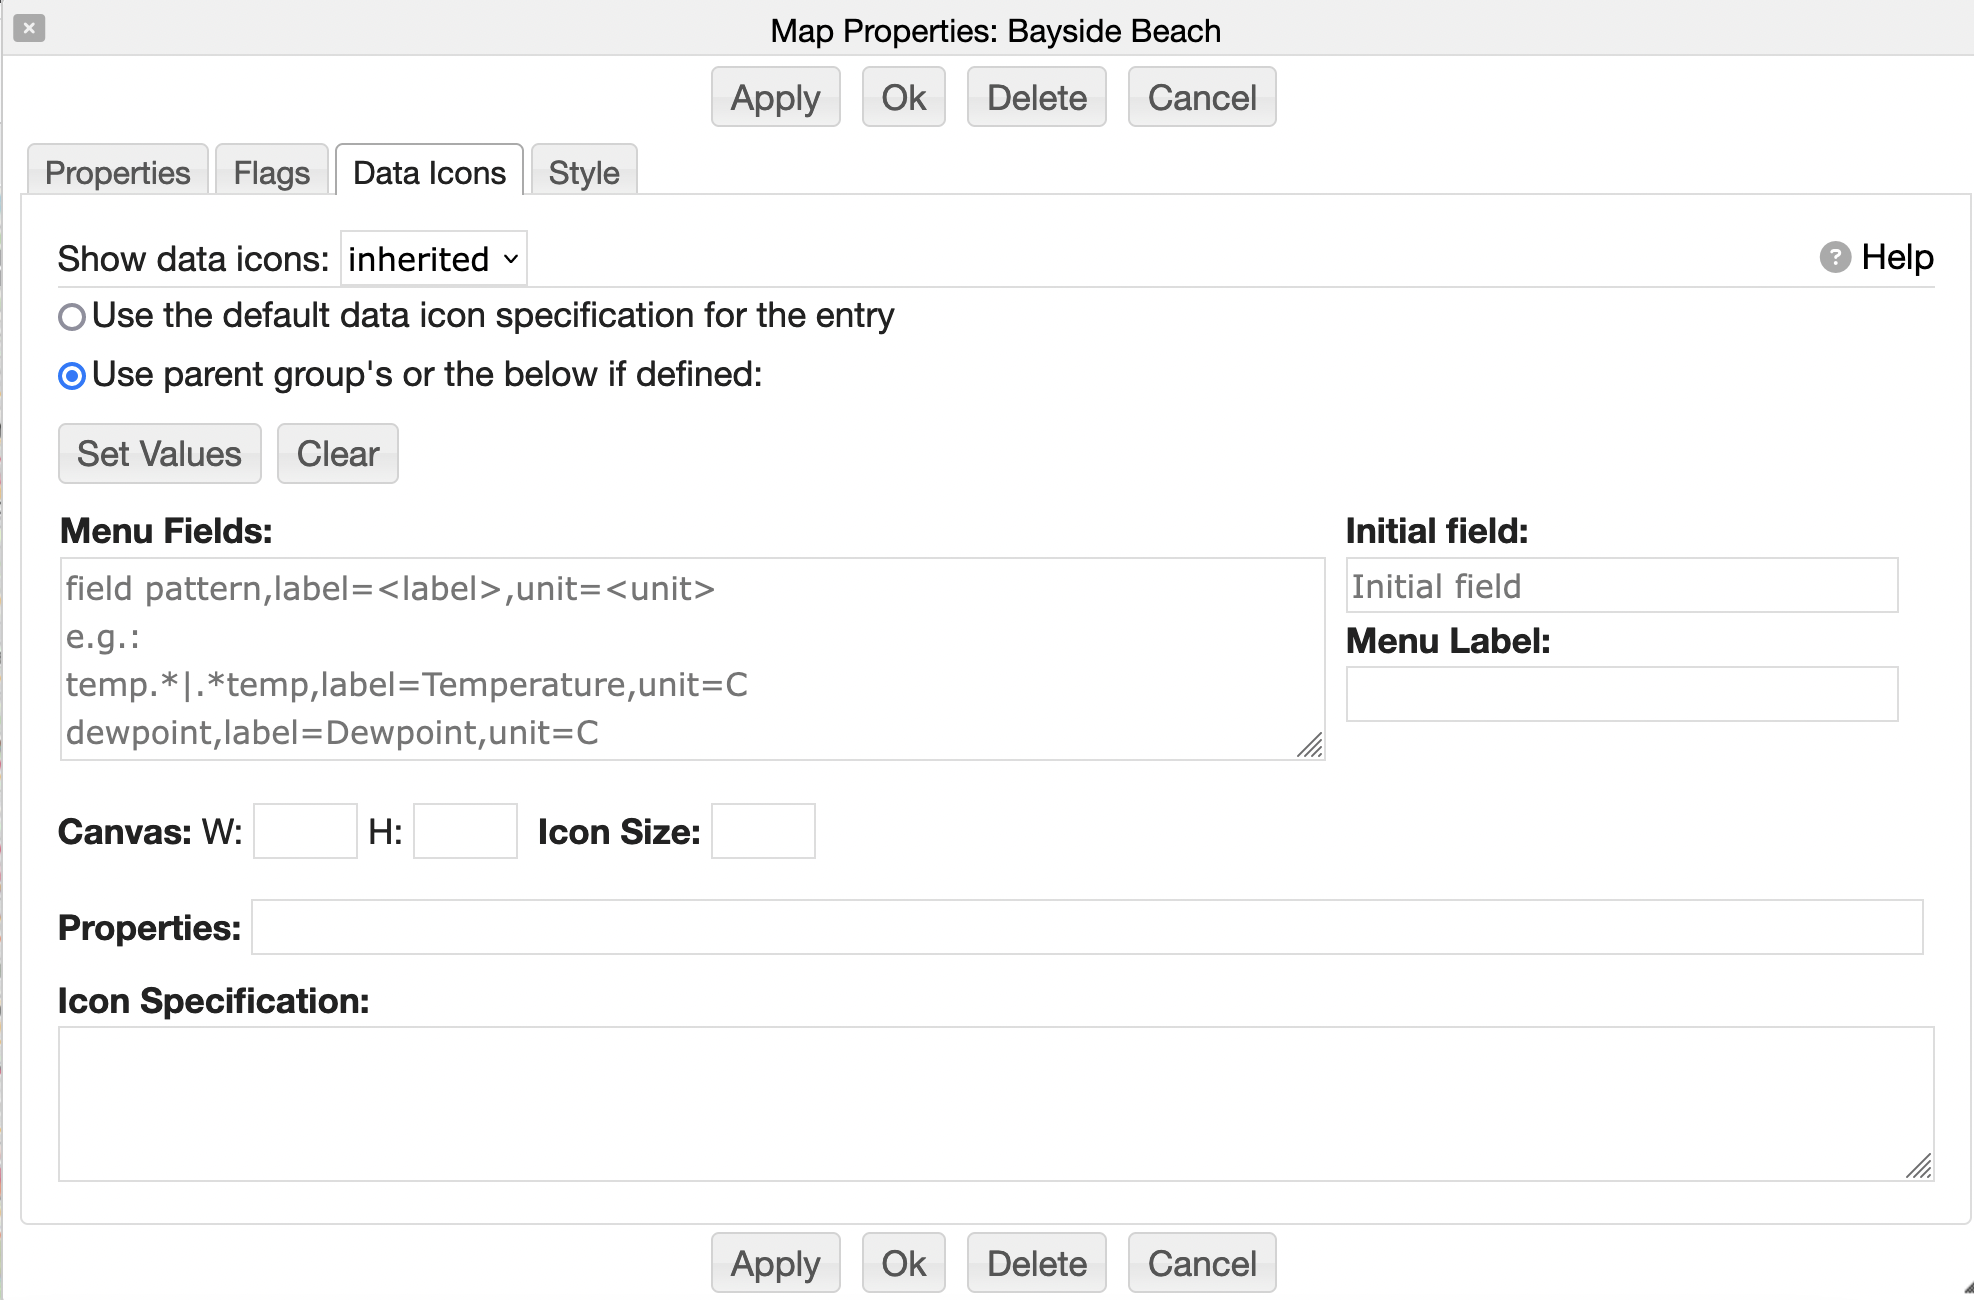
To enable data icon displays bring up the Properties dialog for the relevant glyph
(this may be a Multi-Entry, an Entry Marker or a Group)
in the legend:
Under the Data Icons tab select "yes" for "Show data as icons" and press OK.
Your map should now show the sensor data.
You should have a map that looks like below. From the top-level File menu select Save.
The "Show data as icons" can be "yes", "no" or "inherited". If "inherited" is selected then
if the glyph is under a Group then the data icon settings for the Group are used.
The "Use the default data icon specification for the entry" and
"Use parent group's or the below if defined" toggle specify whether to use
the default data icon for the Entry (like in the Purple Air example) or to
use a custom data icon. Using the parent group's data icon specification
allows one to have a group of data icon glyphs in a map that all have the same representation.
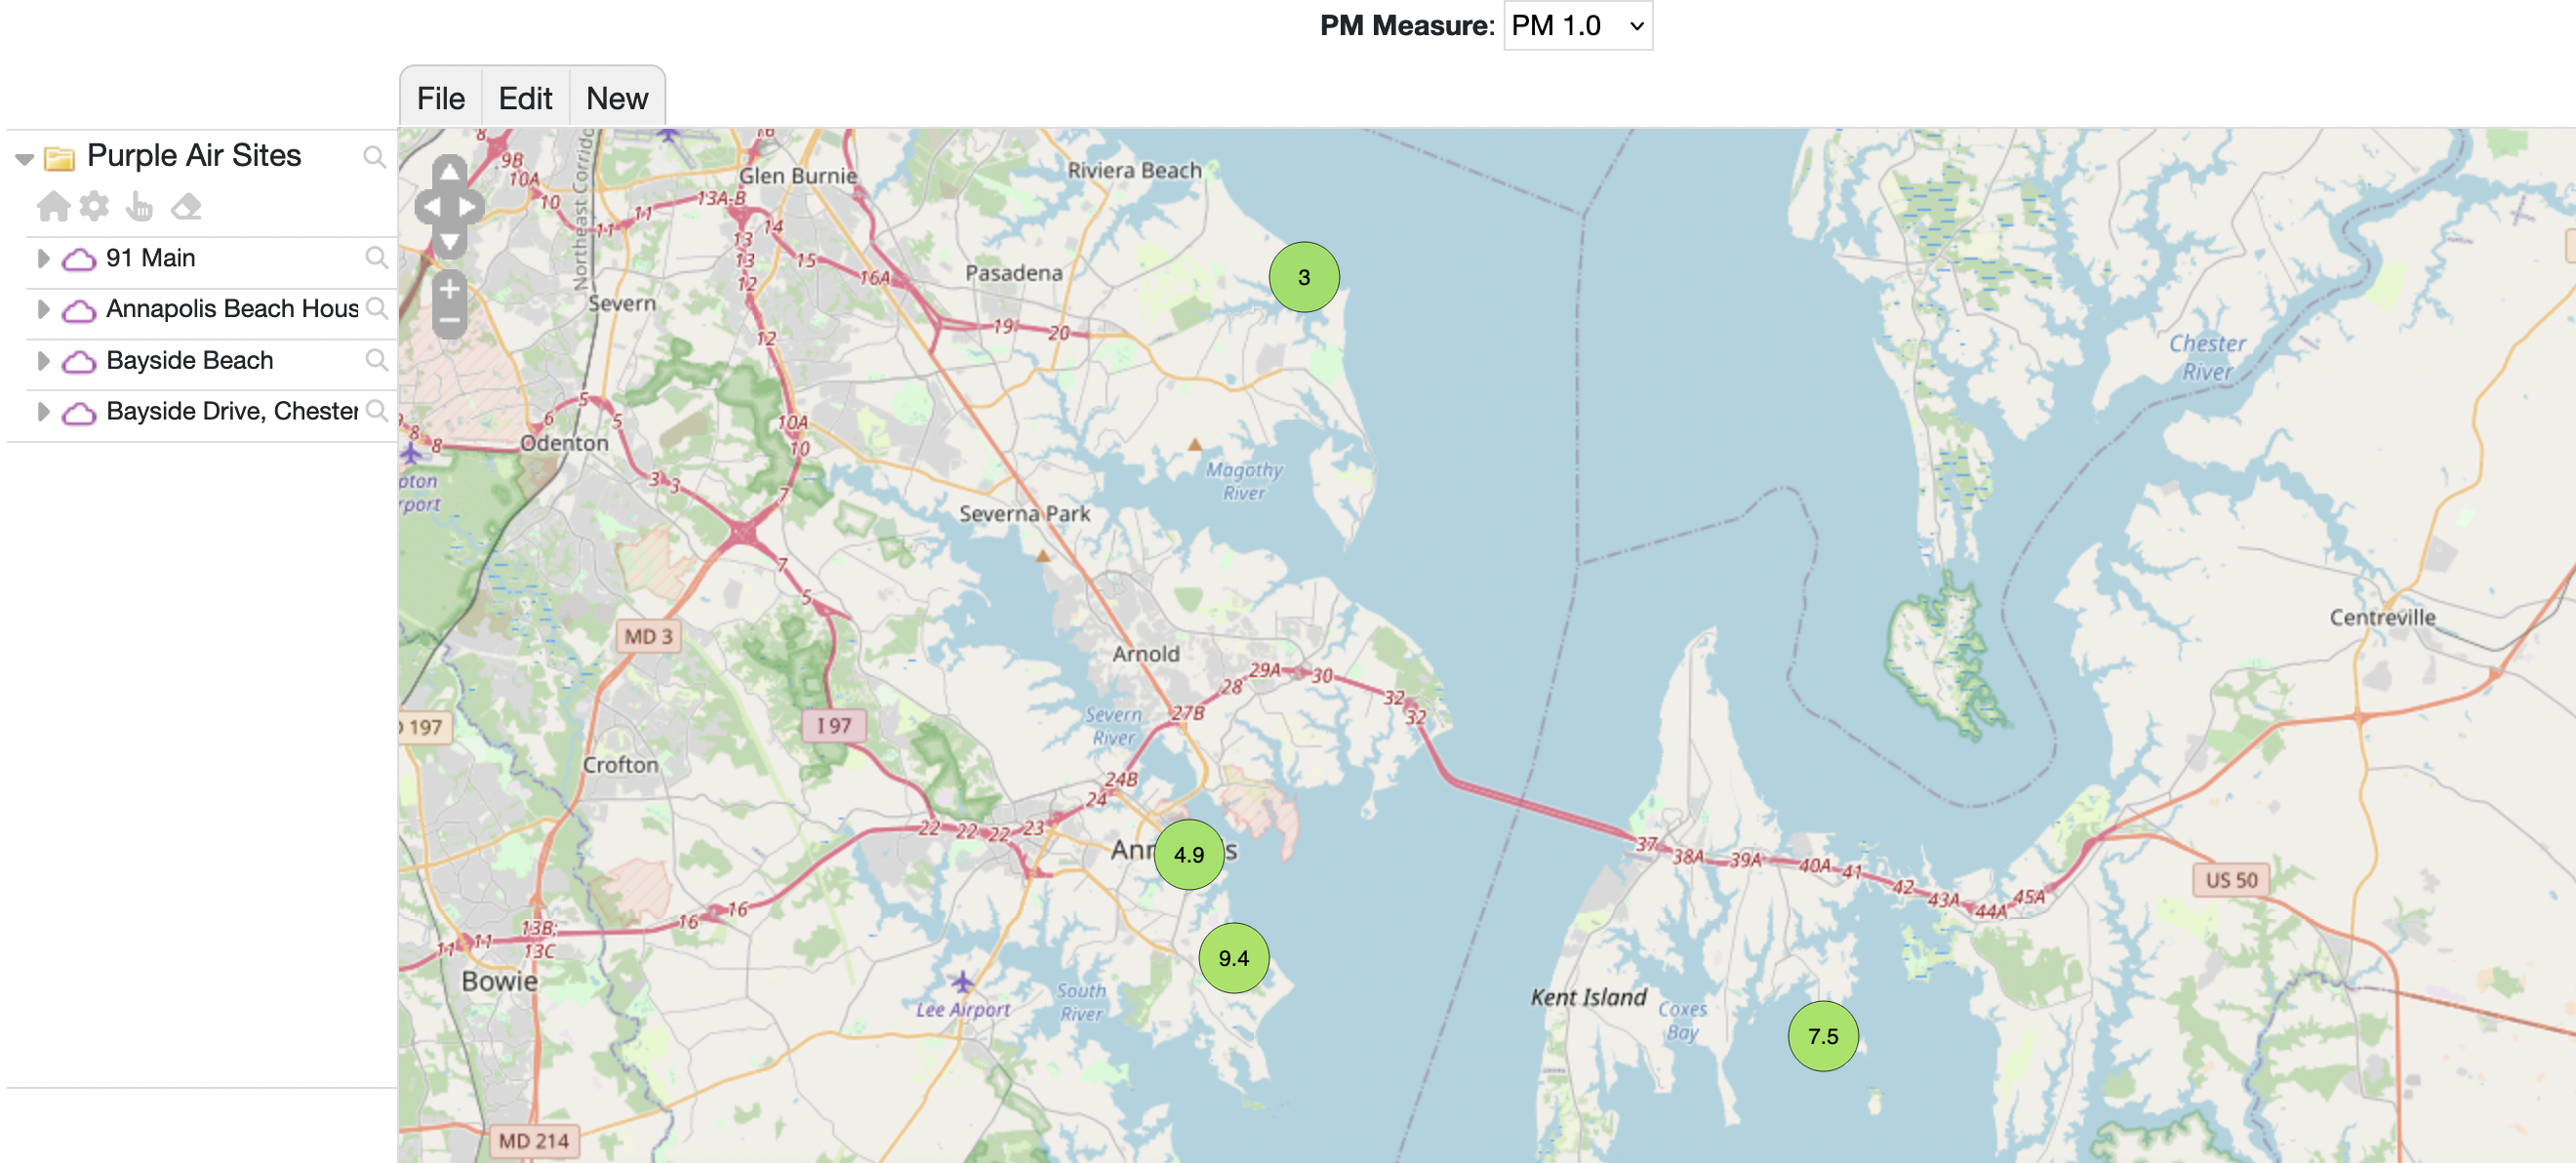
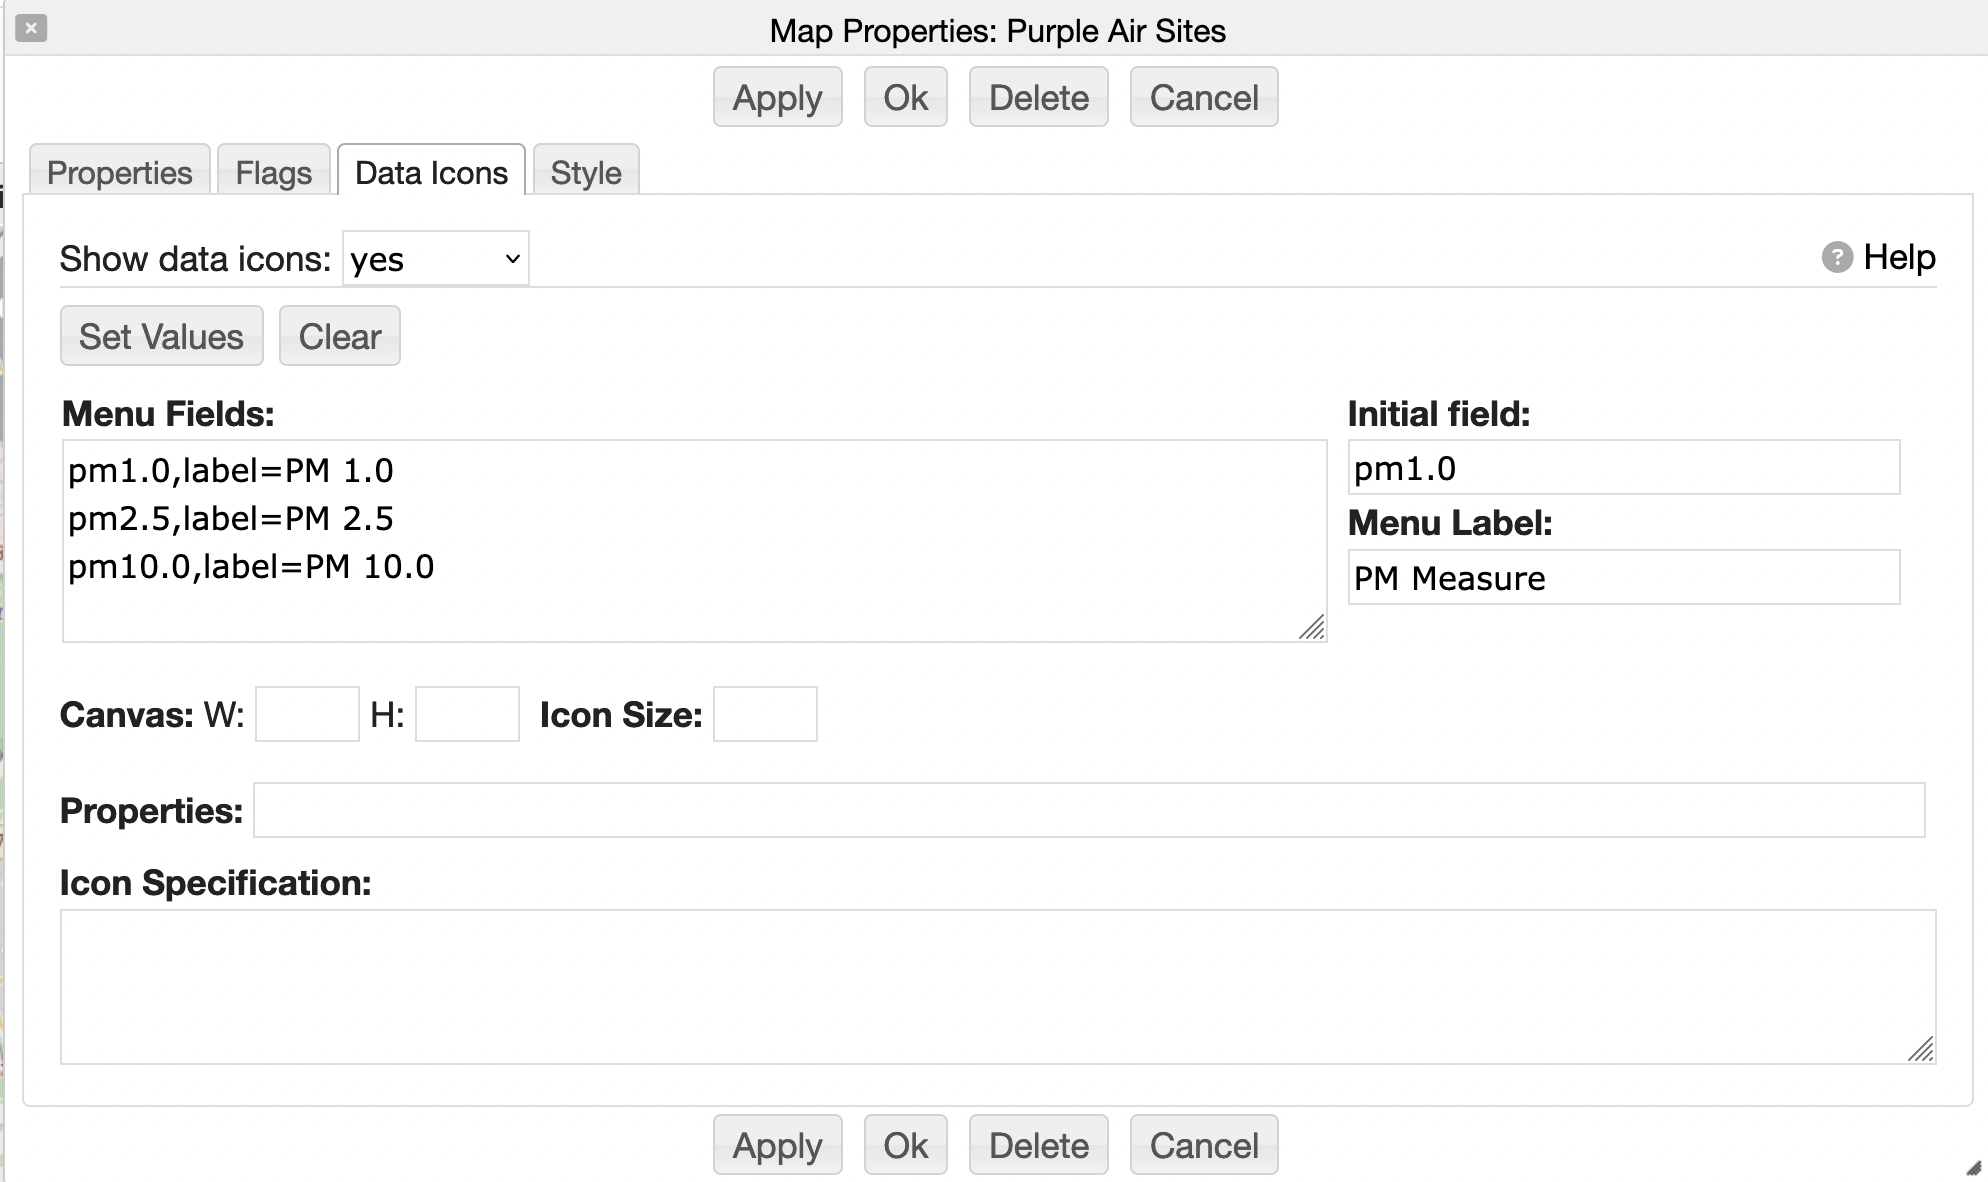
You can add a pull down menu at the top of the page that allows the user to select which field
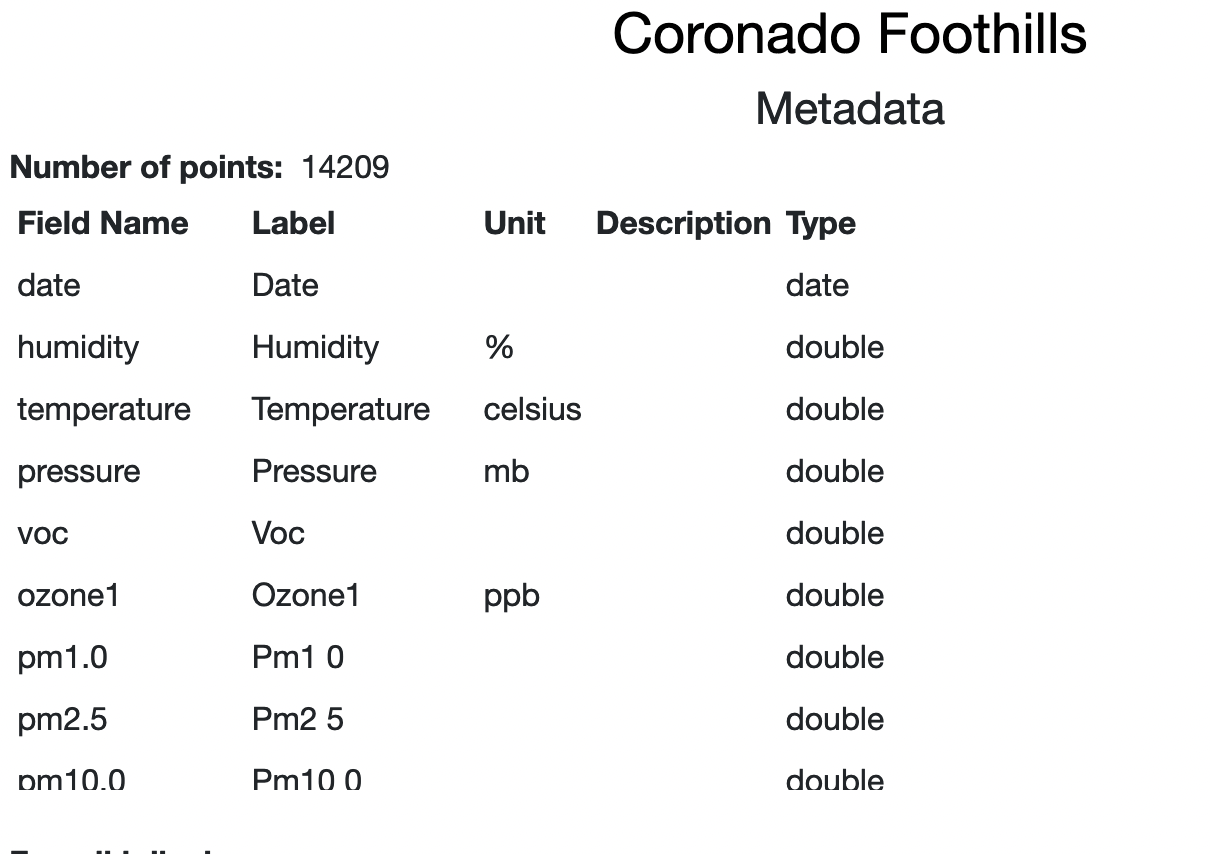
is displayed. To do this you will first need to know what are the field identifiers for
the data entry. Navigate to one of the data entrys you will be displaying, e.g., the Purple Air sensor and view the Metadata page (from the entry's popup menu) to show the metadata. Note the
fields you want to use. For Purple Air we are going to use pm1.0, pm2.5 and pm10.0.
Now, back to the IDMV map, bring up the properties dialog for the multi-entry. Under the Menu Fields
add the fields you want to use. Optionally you can specify an initial field and a menu label.
You can specify an alternative label to show in the menu as below by specifying a
label=... property in the Menu Fields:
You should now have a menu shown that allows you to select the field to display:
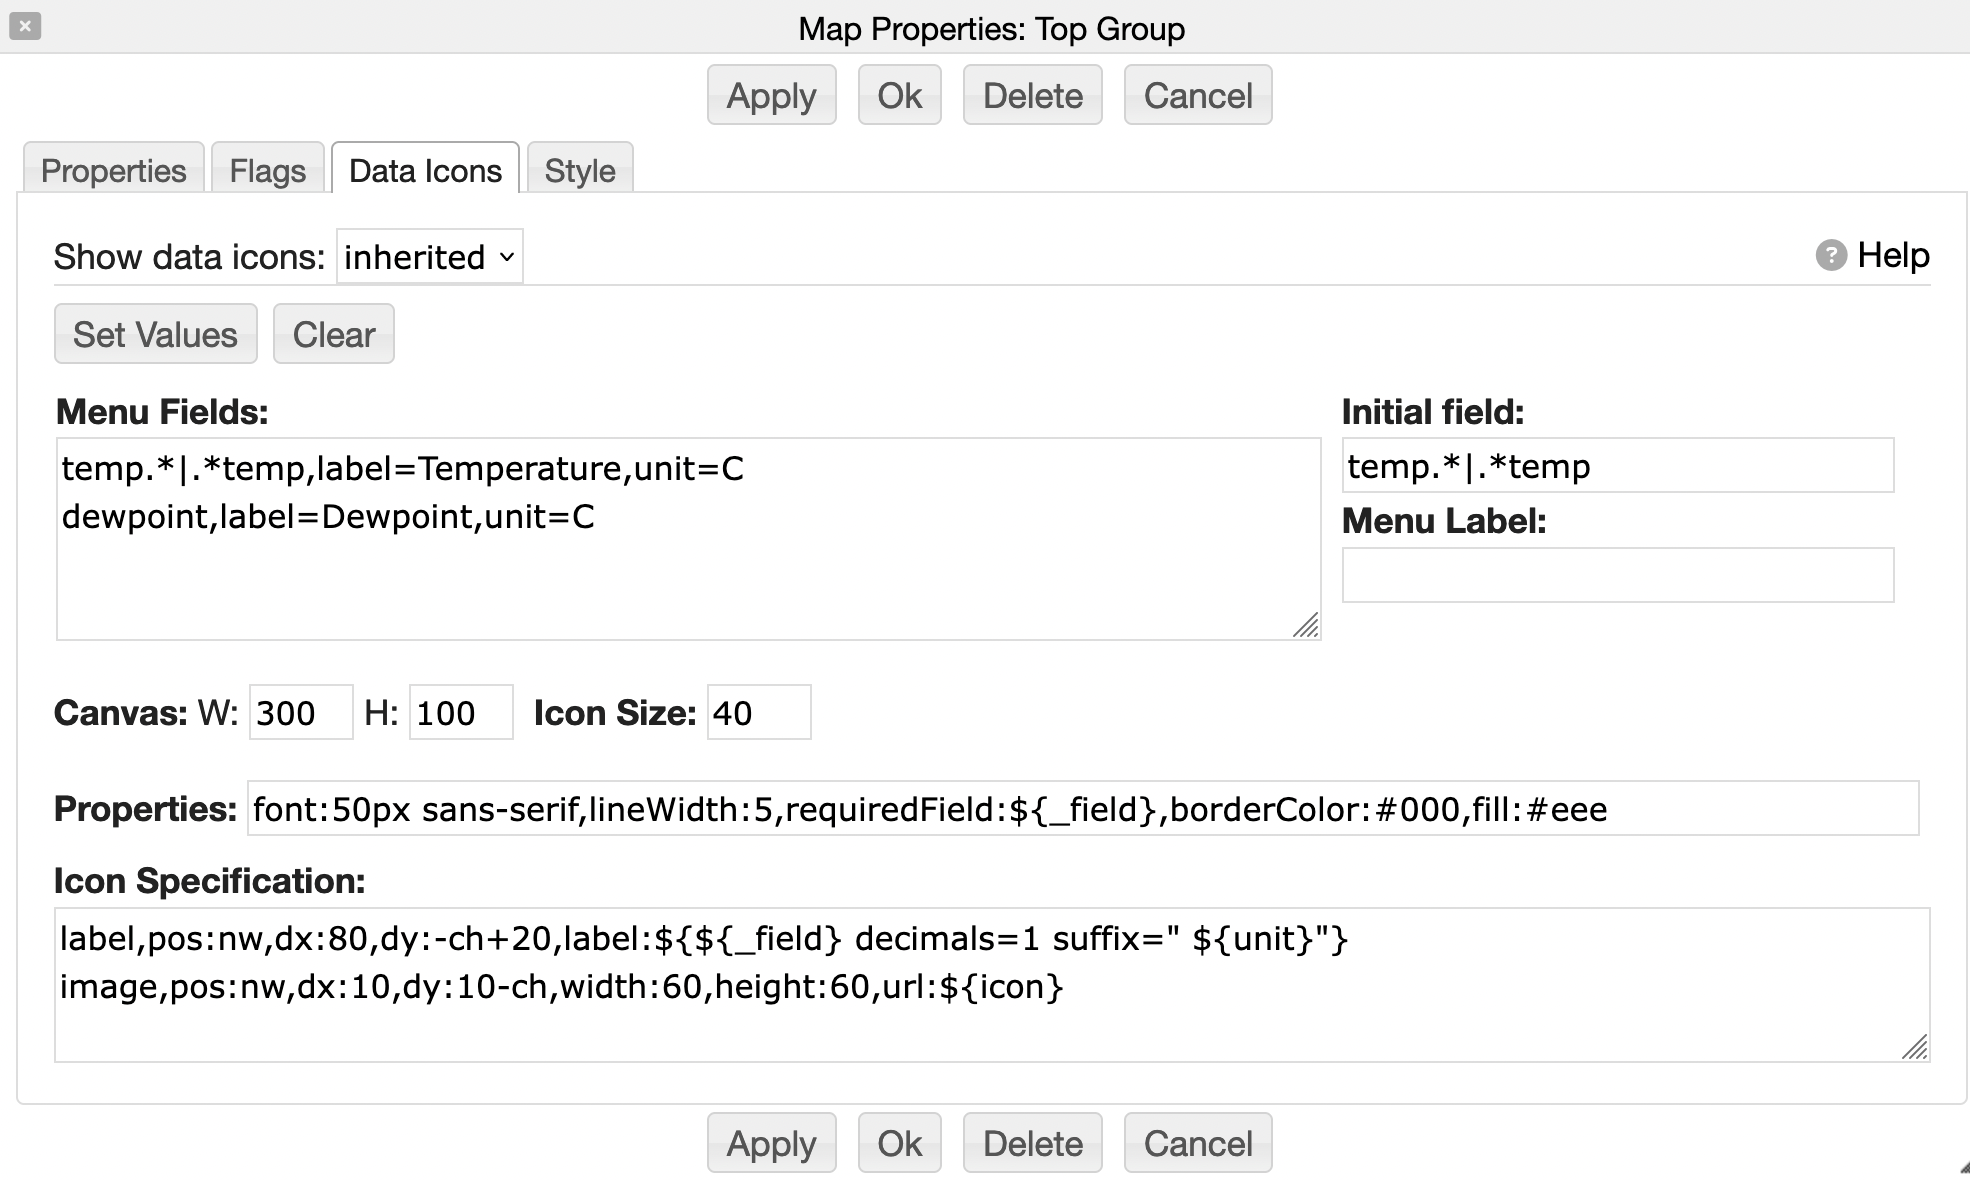
The data icons can be used with a group of entry glyphs where the entries have different data, e.g., CR1000 Data Logger, Purple Air, NWS ASOS data, etc.
The menu fields can have a pattern for the field ID. For example, below the first menu row
matches on any field that is "temperature" or "atmos_temp". The second row just is pm2.5.
temperature|atmos_temp,label=TemperatureX,unit=C
pm2.5,label=PM 2.5
To have all of the data icons be the same format select "Set Defaults", this will override the
default display of the data icons. The Icon Specification is the same as used for the
wiki
canvas display.
Now, with the above settings if the PM2.5 field is selected in the field menu then only those
glyphs that have a data field that matches the selected PM2.5 field will be shown.